%20(1).avif)
Subscribe to our blog
Forget generic dashboards. GA4 empowers you to craft reports tailored to your specific needs. Dive deep into user behavior, track campaign performance, and uncover insights that traditional reports simply miss. It’s time to embrace customization and take control of your digital destiny!
Today, you’ll know more about the intricacies of creating custom reports in GA4 (Google Analytics 4). We’ll provide step-by-step guidance on making the most of these elements, talk about why it’s important, and answer the most popular questions regarding this topic.
Before we start…
Let’s remind ourselves that GA4 offers two different ways to create custom reports: standard reports in the Reports section and dynamic reports in the Explore section.
Customizing standard reports in the Reports section is suitable for cases requiring a deeper exploration of information, its correlation, intersection, and relationship, which are either unavailable or not provided in standard reports.
Dynamic reports in the Explore section involve a range of different data analysis methods that surpass standard reports. This method of analysis allows for a deeper dive into the data and a detailed examination of user behavior specifics:
- Special queries;
- Various data processing methods;
- Data deepening, merging, or splitting;
- Data filtering and segmentation;
- And other features that make reports extensive and informative.
Although both methods offer advanced analytics capabilities, this guide will focus on creating custom reports in the Reports section. So, let’s get going.
What is a standard report?
Upon connecting GA4 to your site, a significant volume of data starts flowing immediately, generating standard reports. However, analyzing some data requires separate, more precise settings.
Right after connecting GA4 and accessing the Reports section, you’ll see several standard reports, including an overview and real-time ones.
GA4 provides two types of standard reports:
- Detail reports — detailed information on a specific data theme, such as sales volume or other events.
- Overview reports — summary information on a topic of interest.
Each of these reports can be customized for user-specific tasks and needs. In the chapters below, we’ll share insights on tailoring the approach to suit your objectives.
How to determine if standard reports are right for you?
First and foremost, customizing standard reports is ideal when you need readily accessible reports with minimal edits. A custom standard report is easier to set up and use compared to dynamic reports in the Explore section, where one can engage in an in-depth study of the area of interest.
Standard reports are often set up periodically and used to monitor changes on a website or application. They can be customized for analyzing and monitoring:
- Users — who visits your website, what’s their age, preferred devices, etc.
- Actions and events — what actions the users take to achieve their goal.
- Business objectives — the main objectives of the company for customizable resources.
Advantages of GA4 standard custom reports
For many websites, e-commerce platforms, and applications, standard reports already contain a minimal set of necessary data. Nevertheless, with GA4 custom reports, you can delve deeper into the customization of analytical data. The ability to create and adapt a report to user needs is one of the main advantages of this tool. Setting up reports in GA4 is extremely simple, even for beginners, and does not require special skills. Even minor changes in reports can reveal more information, enhance marketing efficiency, optimize the flow of analytical data, and accelerate business decision-making.
Types of standard reports
In GA4, there are two categories of standard reports: overview and detail reports, each with its own focus and visual style.
While hiding or deleting standard reports in GA4 might seem counterintuitive, think of it like cleaning an analytics closet. You’re making space for the reports you truly need, and organizing things so everything’s easily accessible.
Overview reports primarily display information through summary cards grouped by a common theme. An example of such a report can be found in Reports > Engagement > Overview.
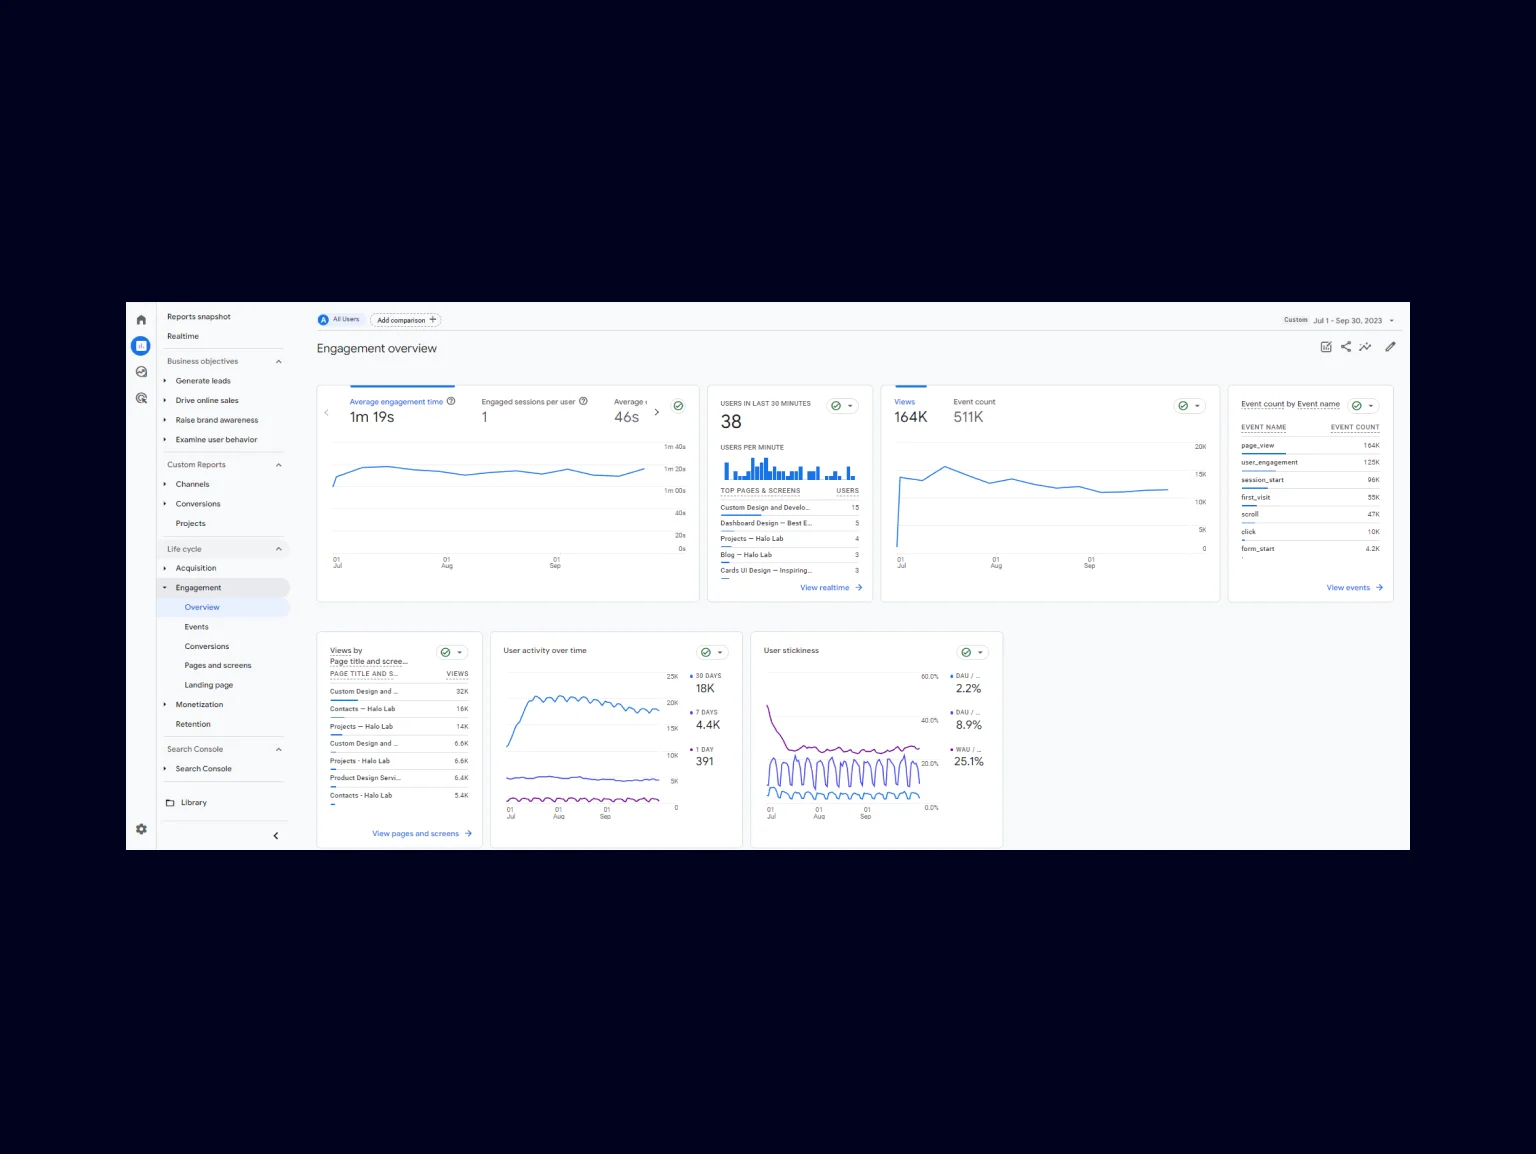
Detail reports display data in the form of tables and charts, providing more detailed information in the area of interest. You can find an example of such a report in Reports > Acquisition > User acquisition.
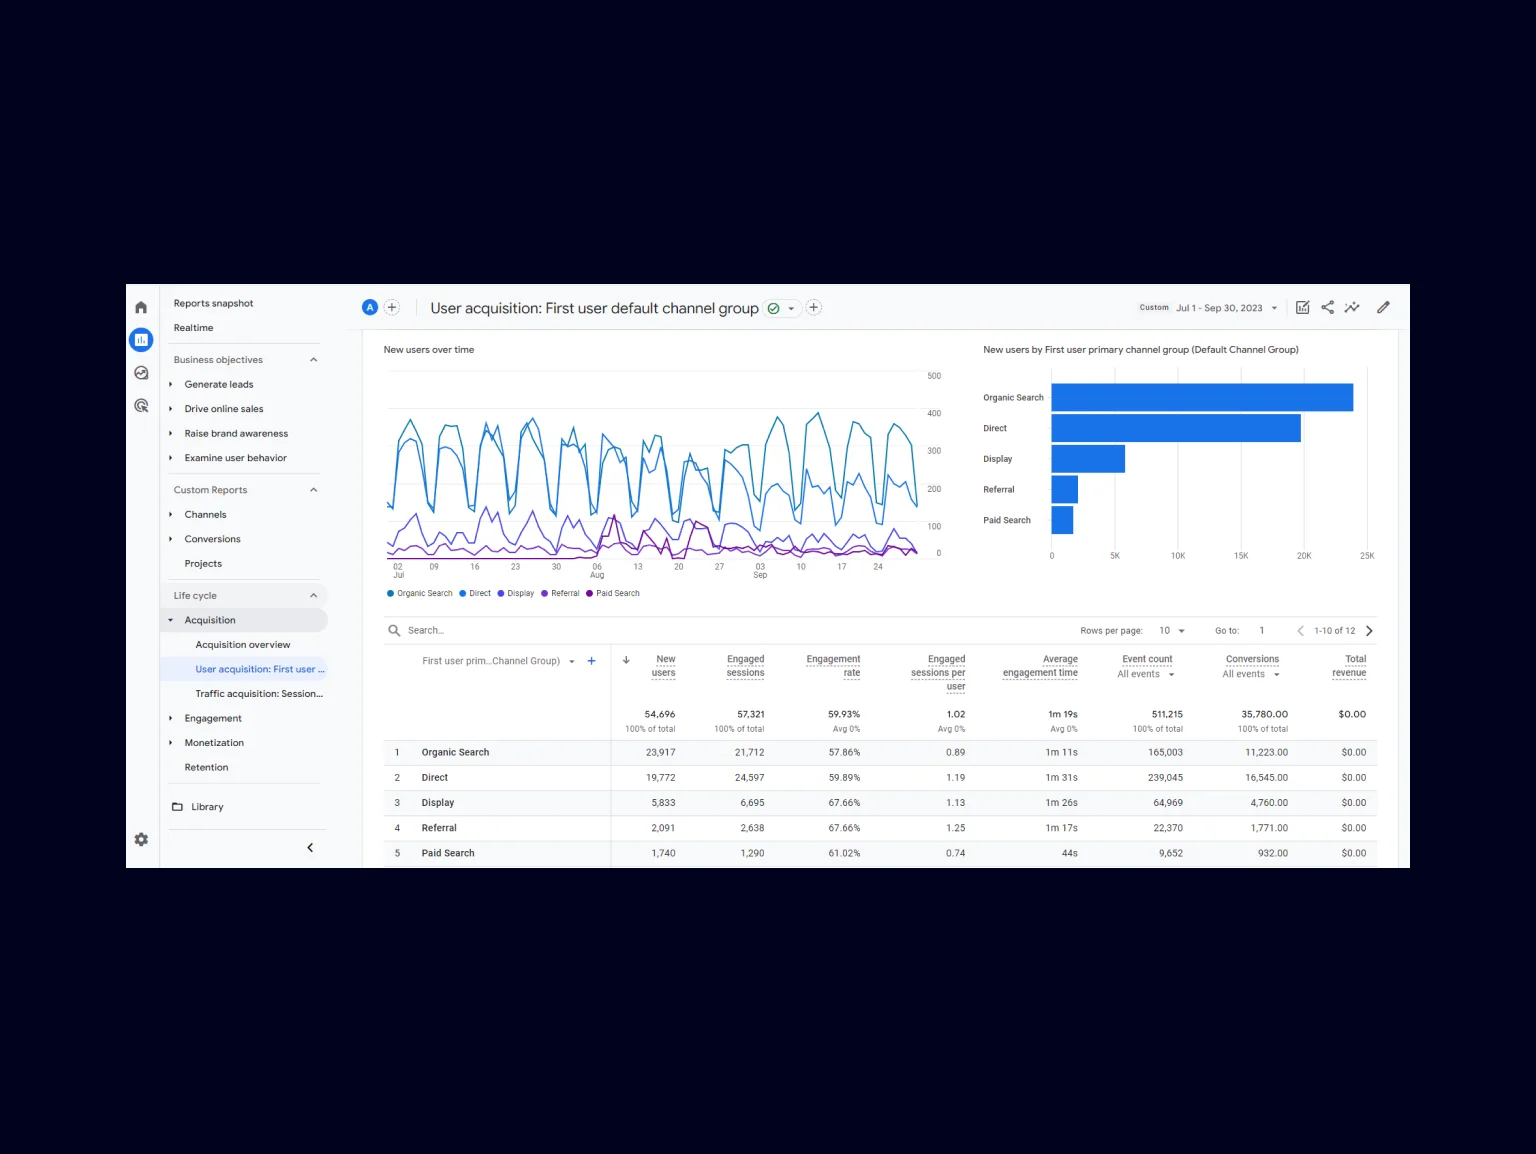
A detail report in GA4 is an essential tool for comprehensive analysis of specific indicators, providing users with rich data. A standard detail report consists of 2 charts and a table. Charts display brief information that is placed in the table part.
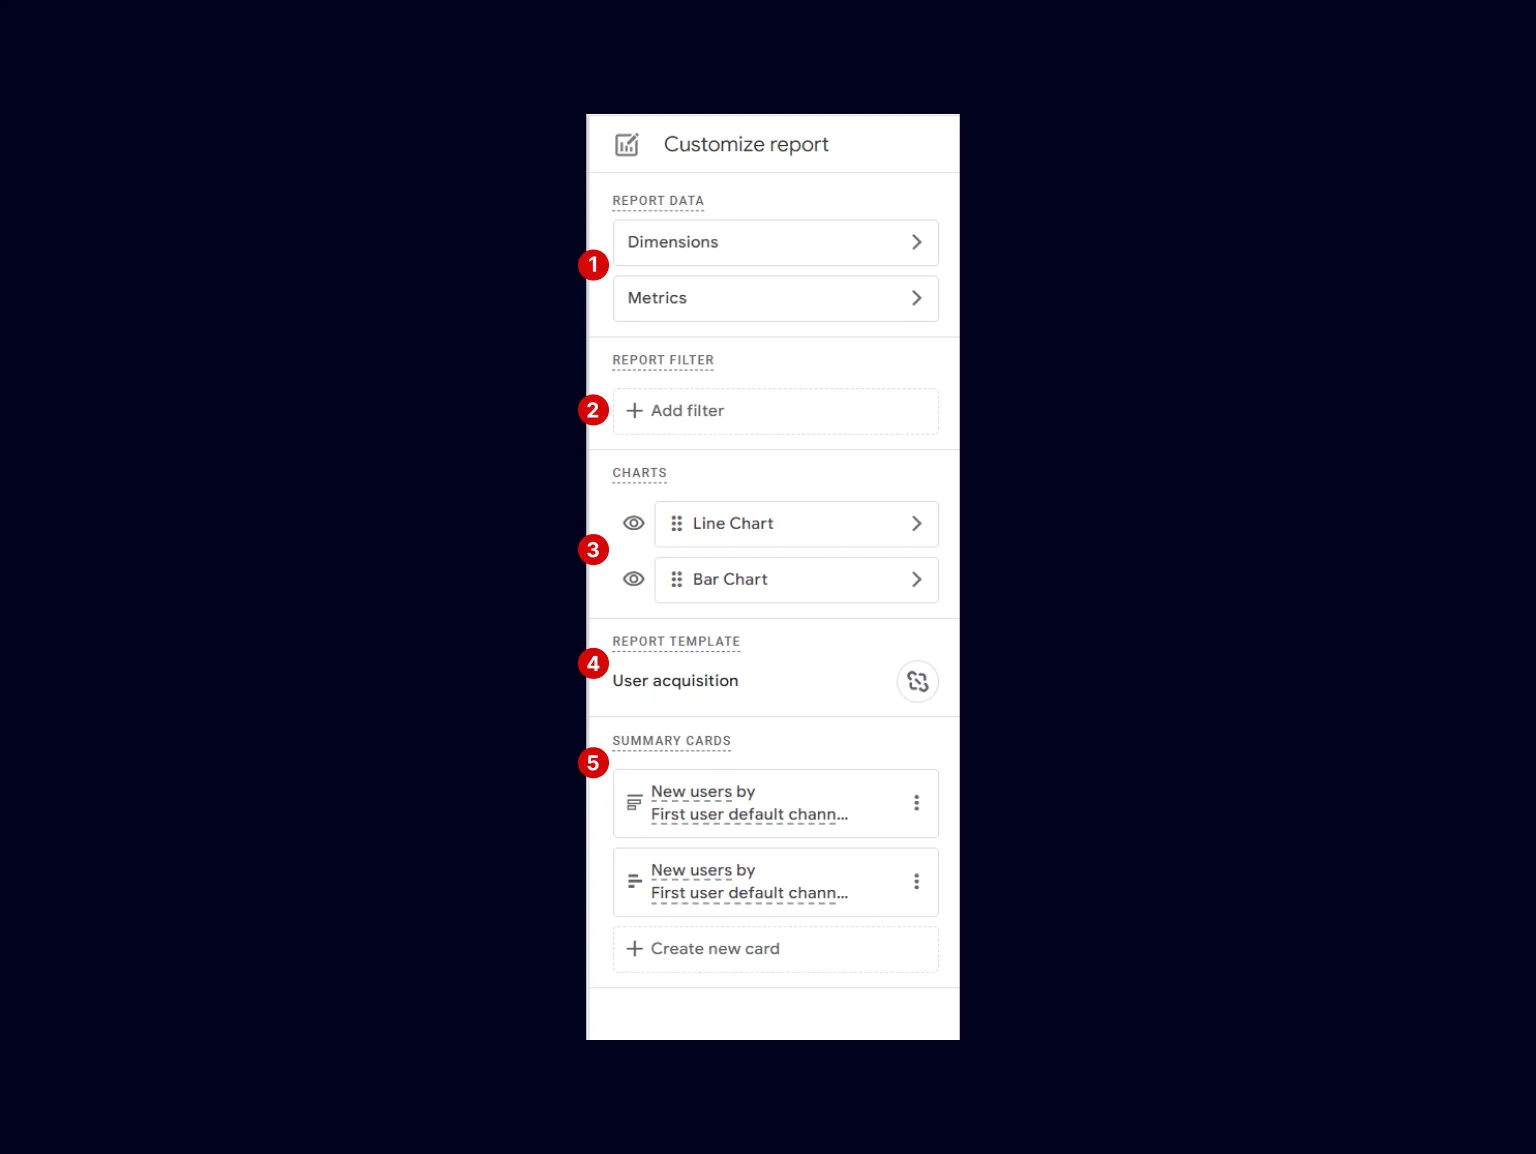
There are options to customize various parameters — check them in the list below:
- Dimensions & Metrics. This allows for choosing from a multitude of measurements and quantitative data, combining and breaking down data to refine the focus of analysis.
- Report filter. This one is about the ability to apply a filter (in case you want to view only specific data of interest in a particular case).
- Charts. They are displayed at the top of a detail report. Overall, there are two charts you can see. If needed, they can be disabled individually.
- Report template. This feature is utilized in a new report. Changing a template automatically changes an edited report. Also, note that the link to a template can be canceled on your demand.
- Summary cards. These are visual elements within an Overview report that summarize key insights from detail reports.
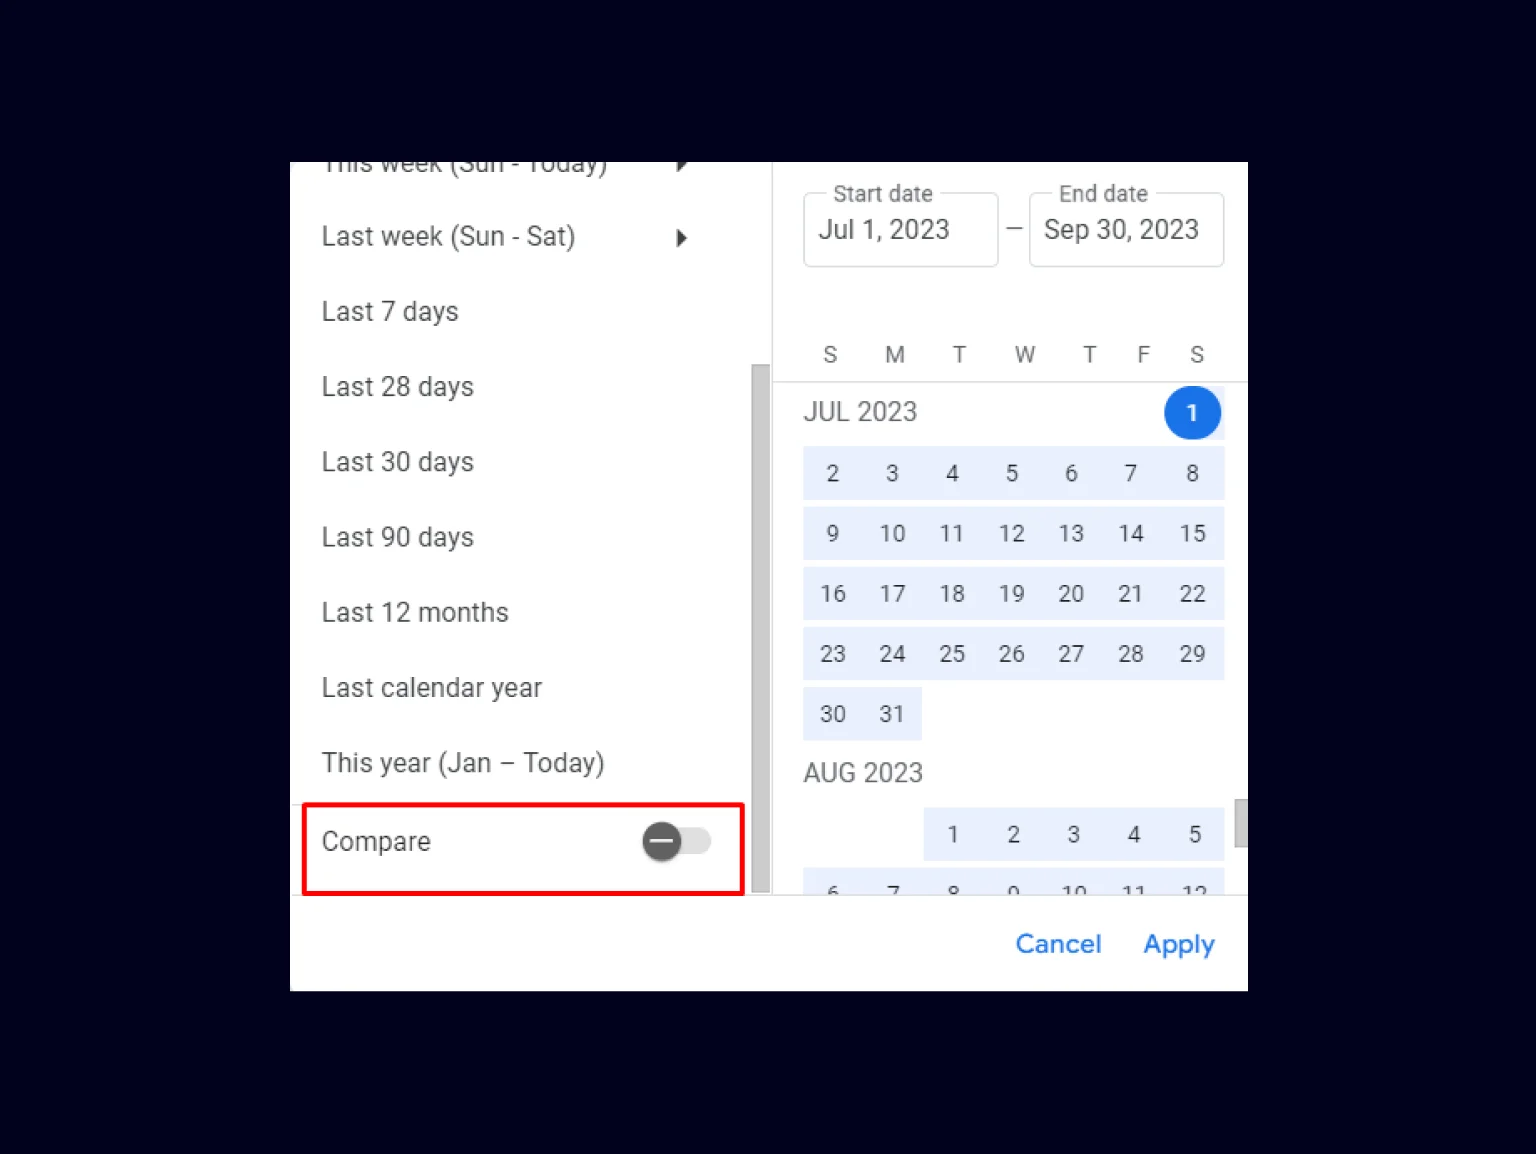
By default, the date range in detail reports is set to the last 28 days. You should note that modifying the date range directly from the report editing panel is not feasible. To adjust the date range, you must navigate to the Reports section, located in the top right corner. However, remember that changing the dates will affect all reports in the Reports section. To compare dates, you should activate the Compare option from the menu.
Overview report
The overview report is equally important and has its own characteristics. It is a simplified summary set of data on a certain topic, often needed for quick familiarization with analytics results. As mentioned earlier, overview reports are found in the Reports section. Examples of overview reports:

Moving forward, let’s explore scenarios where customizing a report becomes essential to meet the specific analytical needs of a specialist. We’re talking about situations when analysts need to tackle specific tasks or answer questions that go beyond the information provided by the default reports.
Customizing standard reports
When there’s a need to conduct a more in-depth analysis of website data and tailor the report to specific requirements, you have the option to apply certain settings to customize standard reports. This allows for delving deeper into the data and extracting insights that align with our unique objectives and purposes.
How to customize standard reports?
This is a simple process and it involves 2 options for implementation.
- The first option is direct customization of an existing report in the Reports section by clicking on the Customize report button. This way, you get the opportunity to customize the existing report according to your goals.
- The second option is a more detailed approach, where you can create an entirely new report or improve an existing one in the Library section. This allows for composing reports that meet unique requirements for data display and analysis.
Direct customization of existing reports
Editing and customizing reports usually requires administrator-level access. Therefore, if you find that you cannot make changes, it’s recommended to check your user rights or seek help from an administrator.
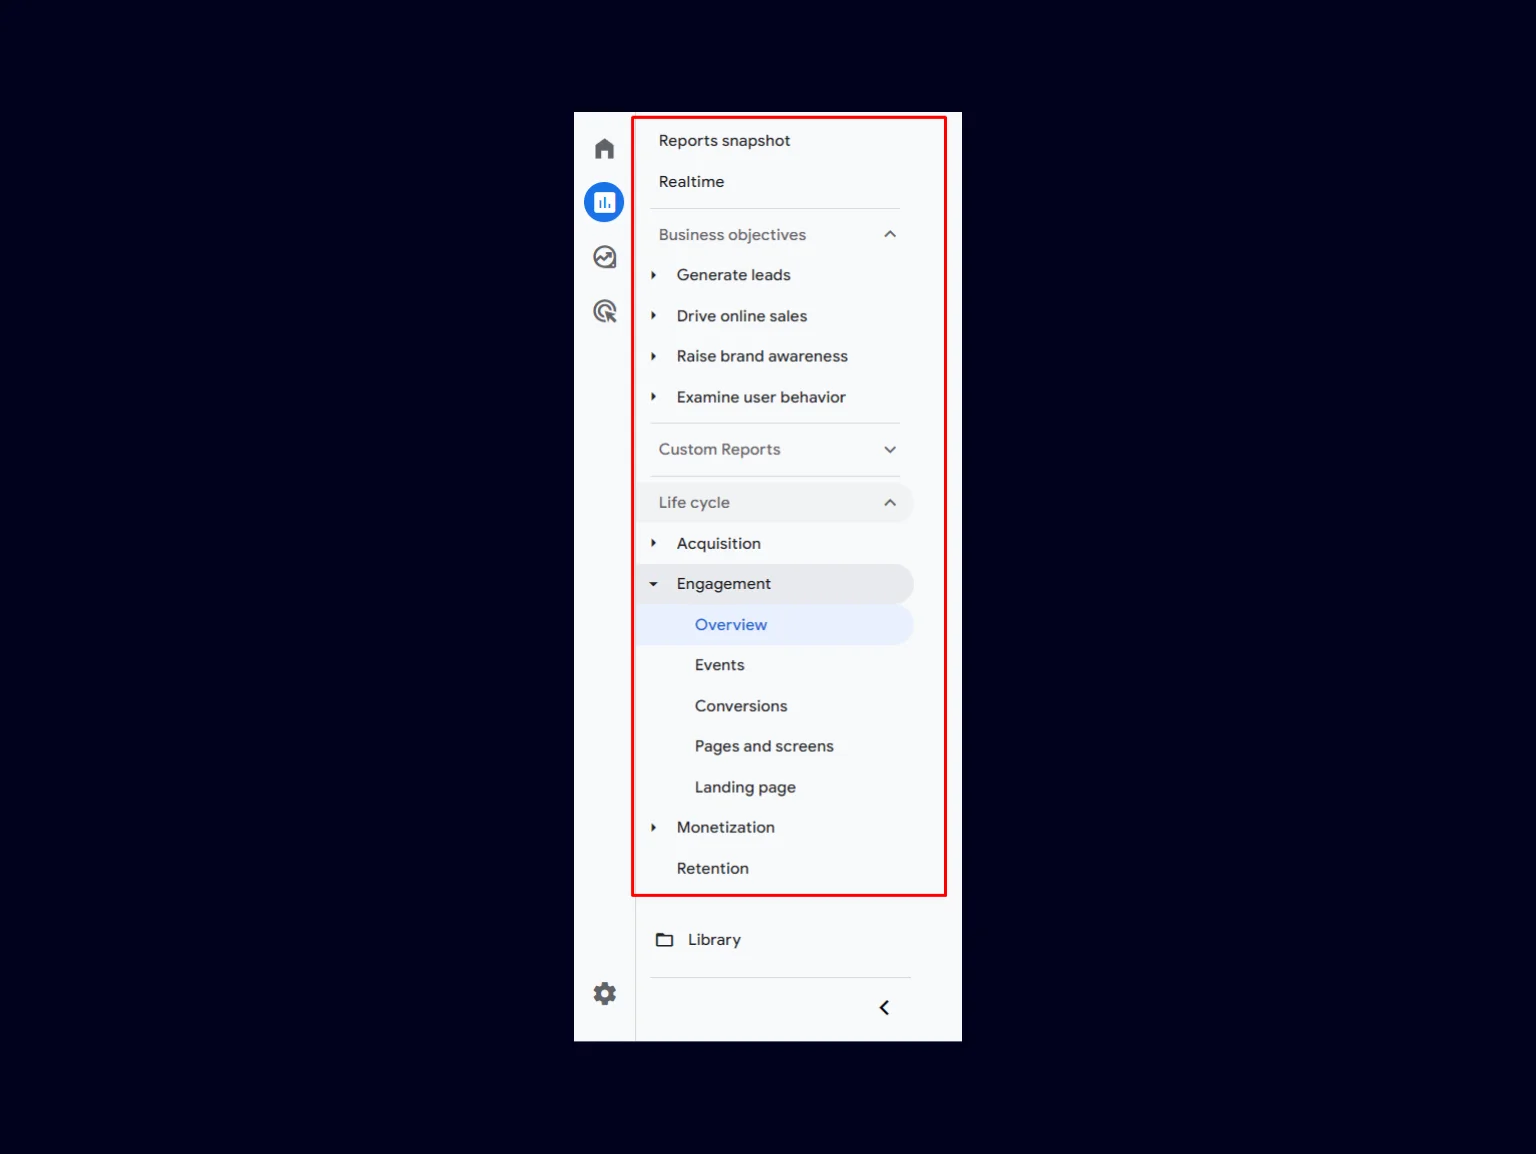
Step 1: Click on the Reports section and select either an overview or a detail report.
To start editing an existing report, choose it from the left menu in the Reports section.
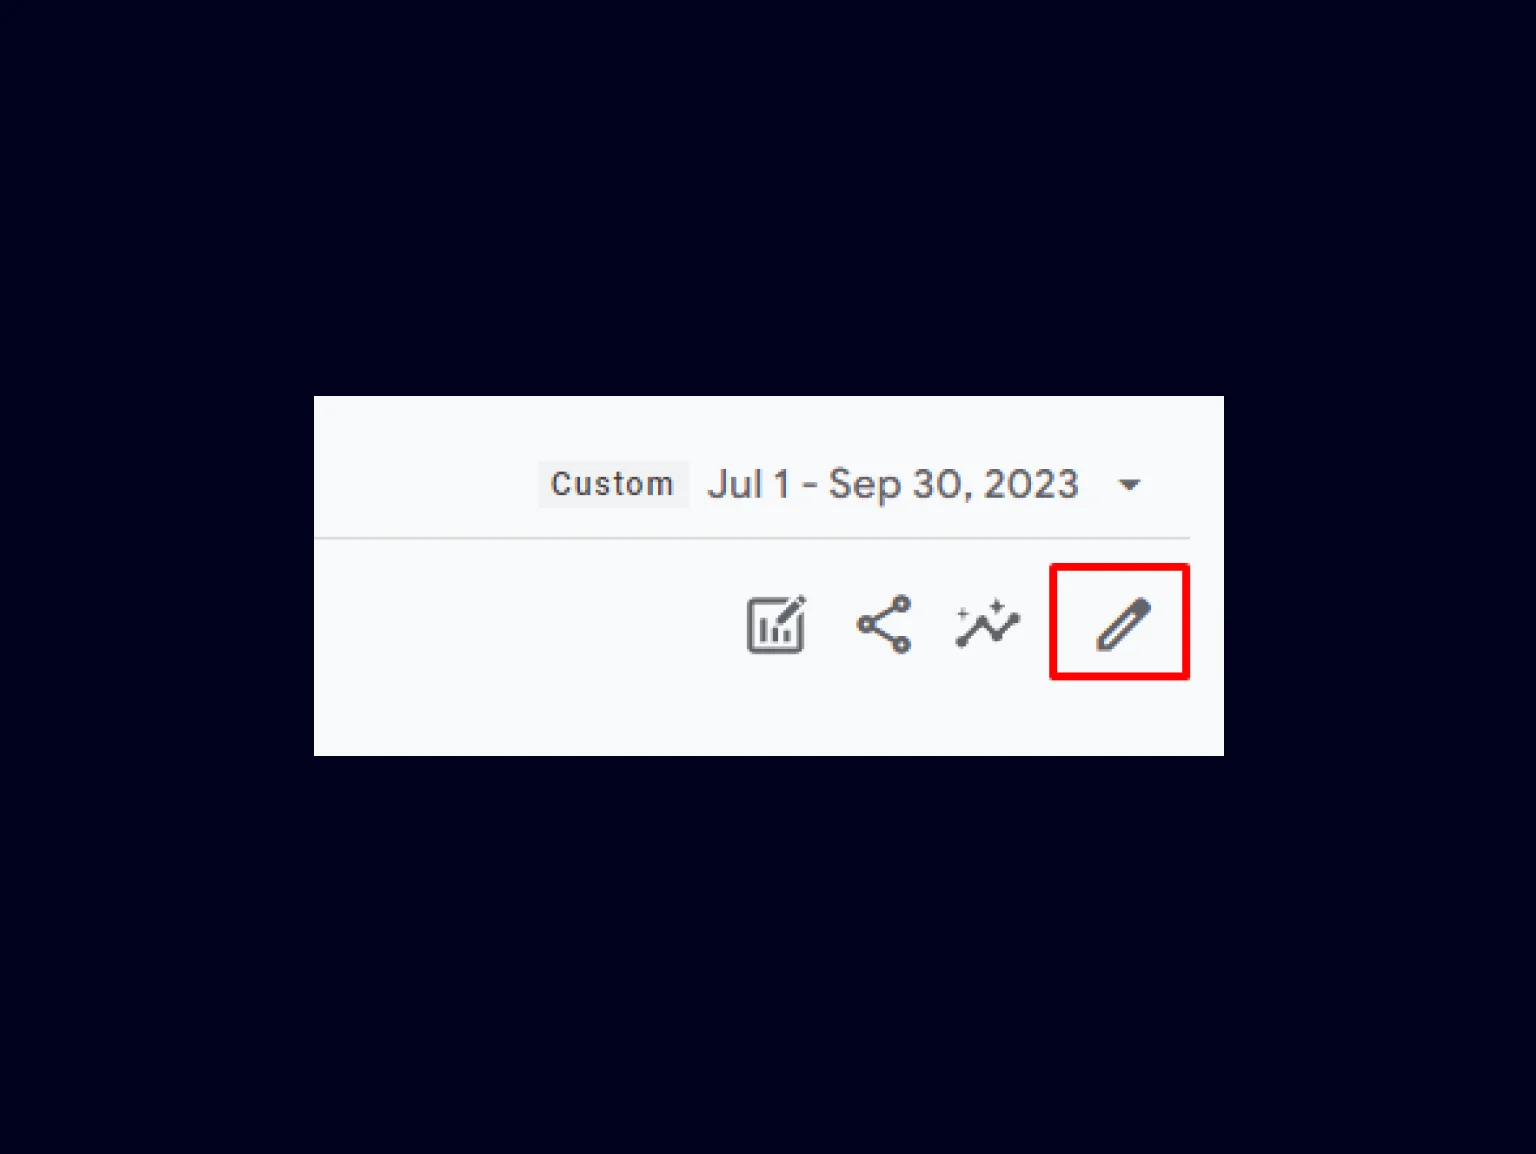
Step 2: Click on the Customize report icon.
After selecting the desired report, click on the Customize report icon.
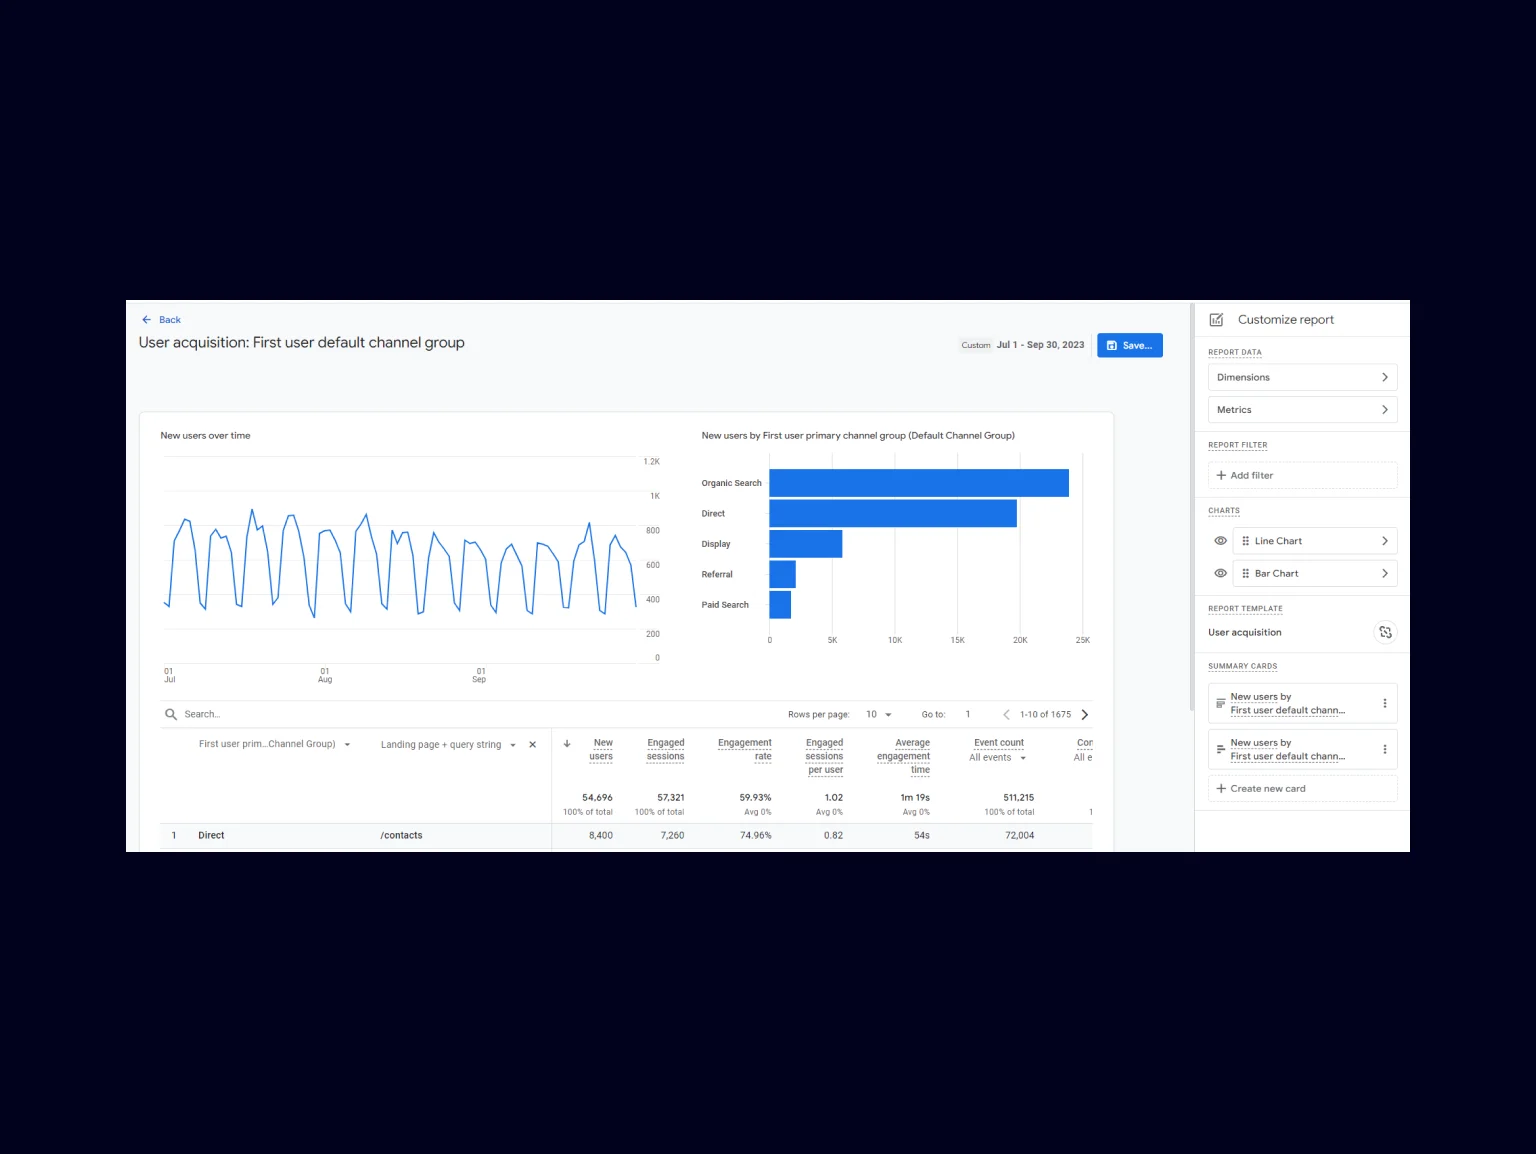
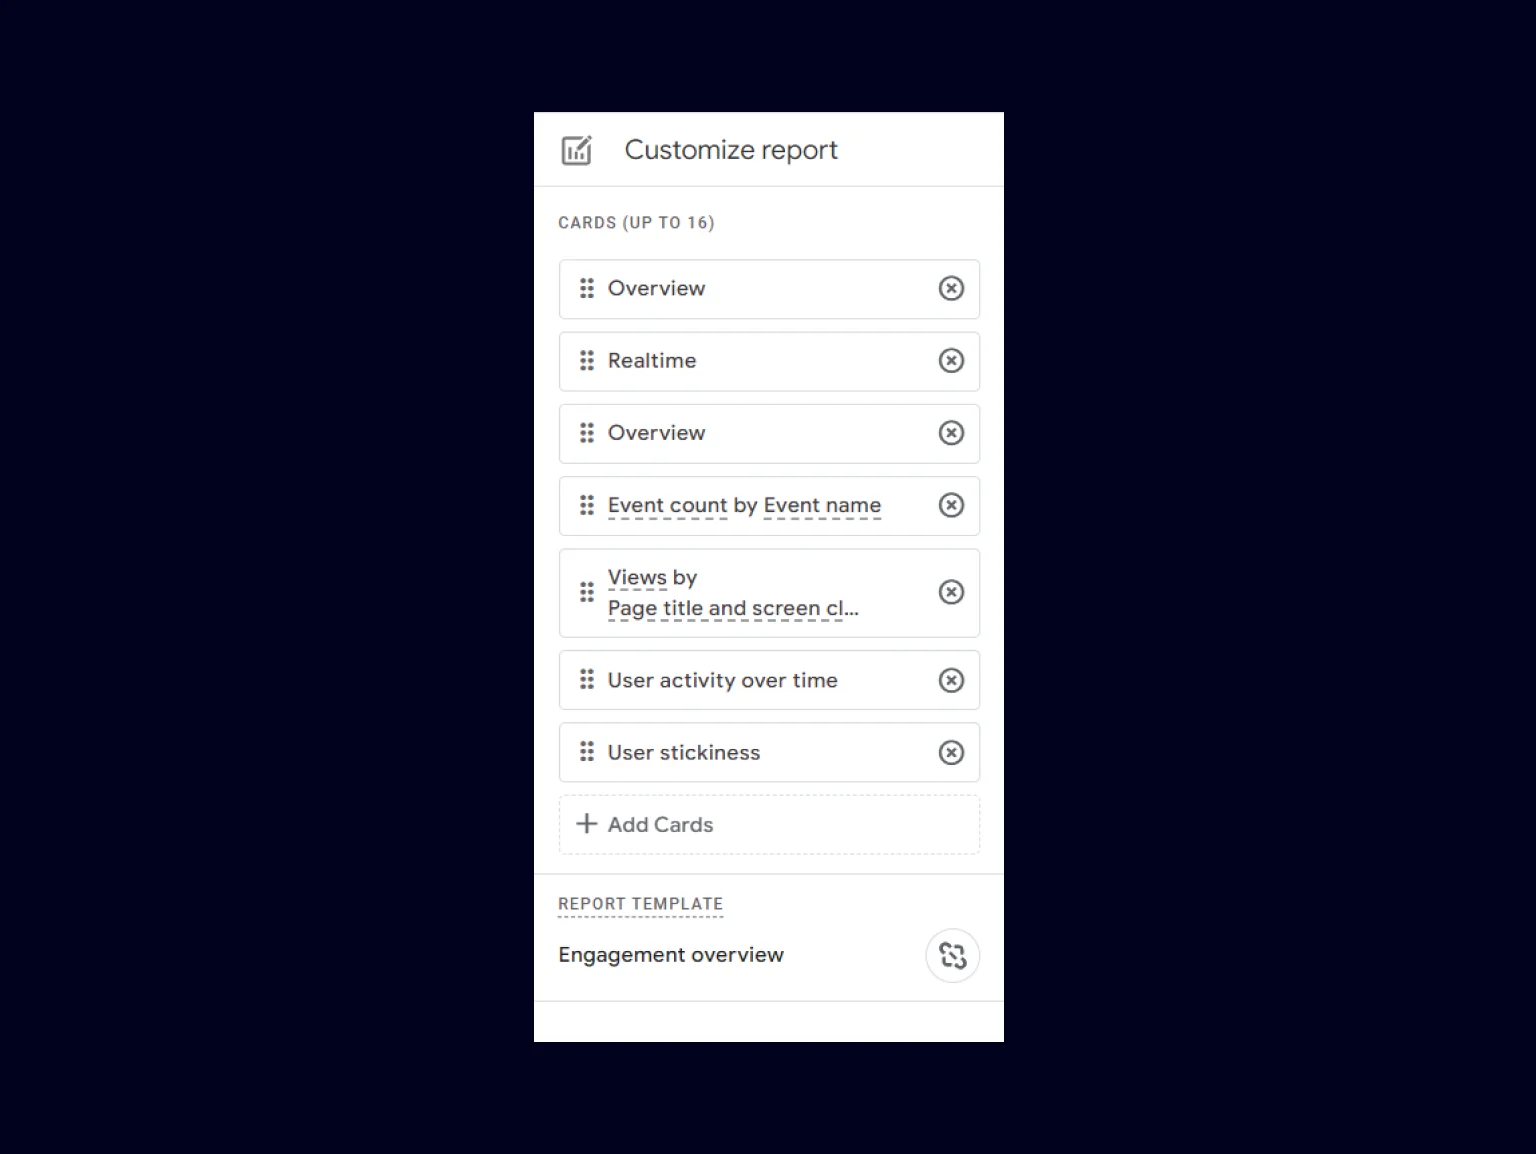
Step 3: Customize report elements.
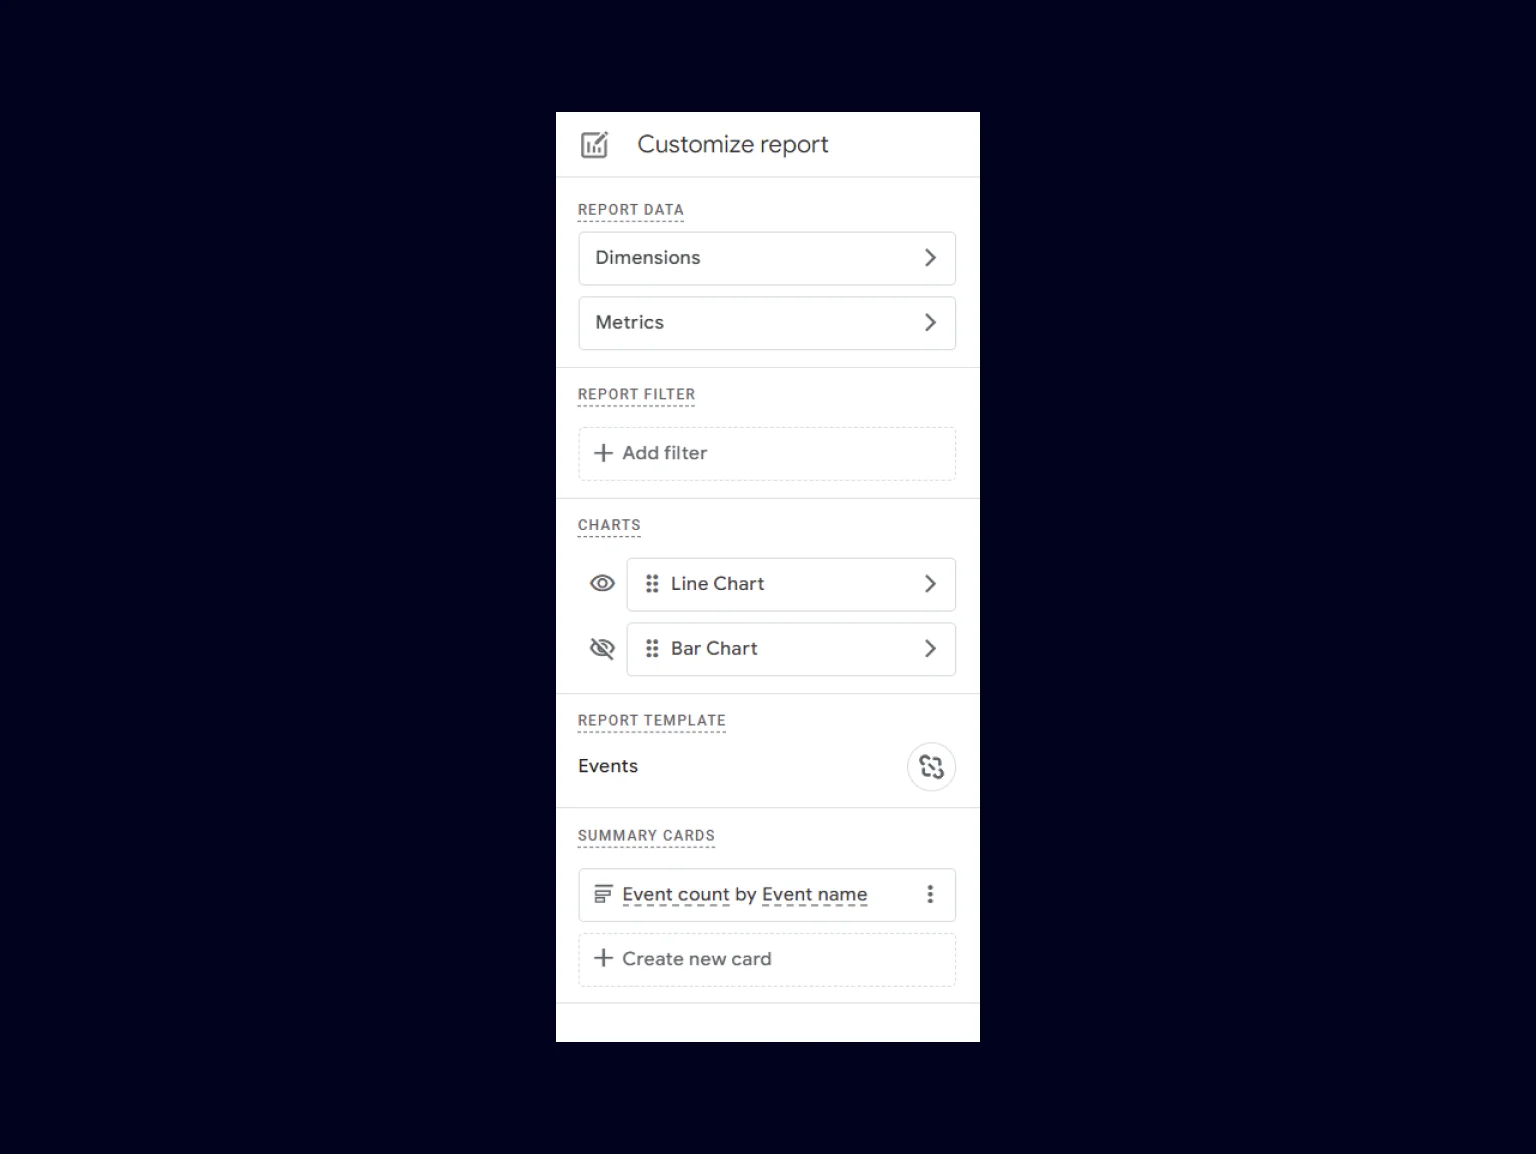
A report customization panel will appear with many different options.
1. In an overview report, up to 16 data cards available for editing can be displayed in the report. Cards can be added or removed, depending on the task.
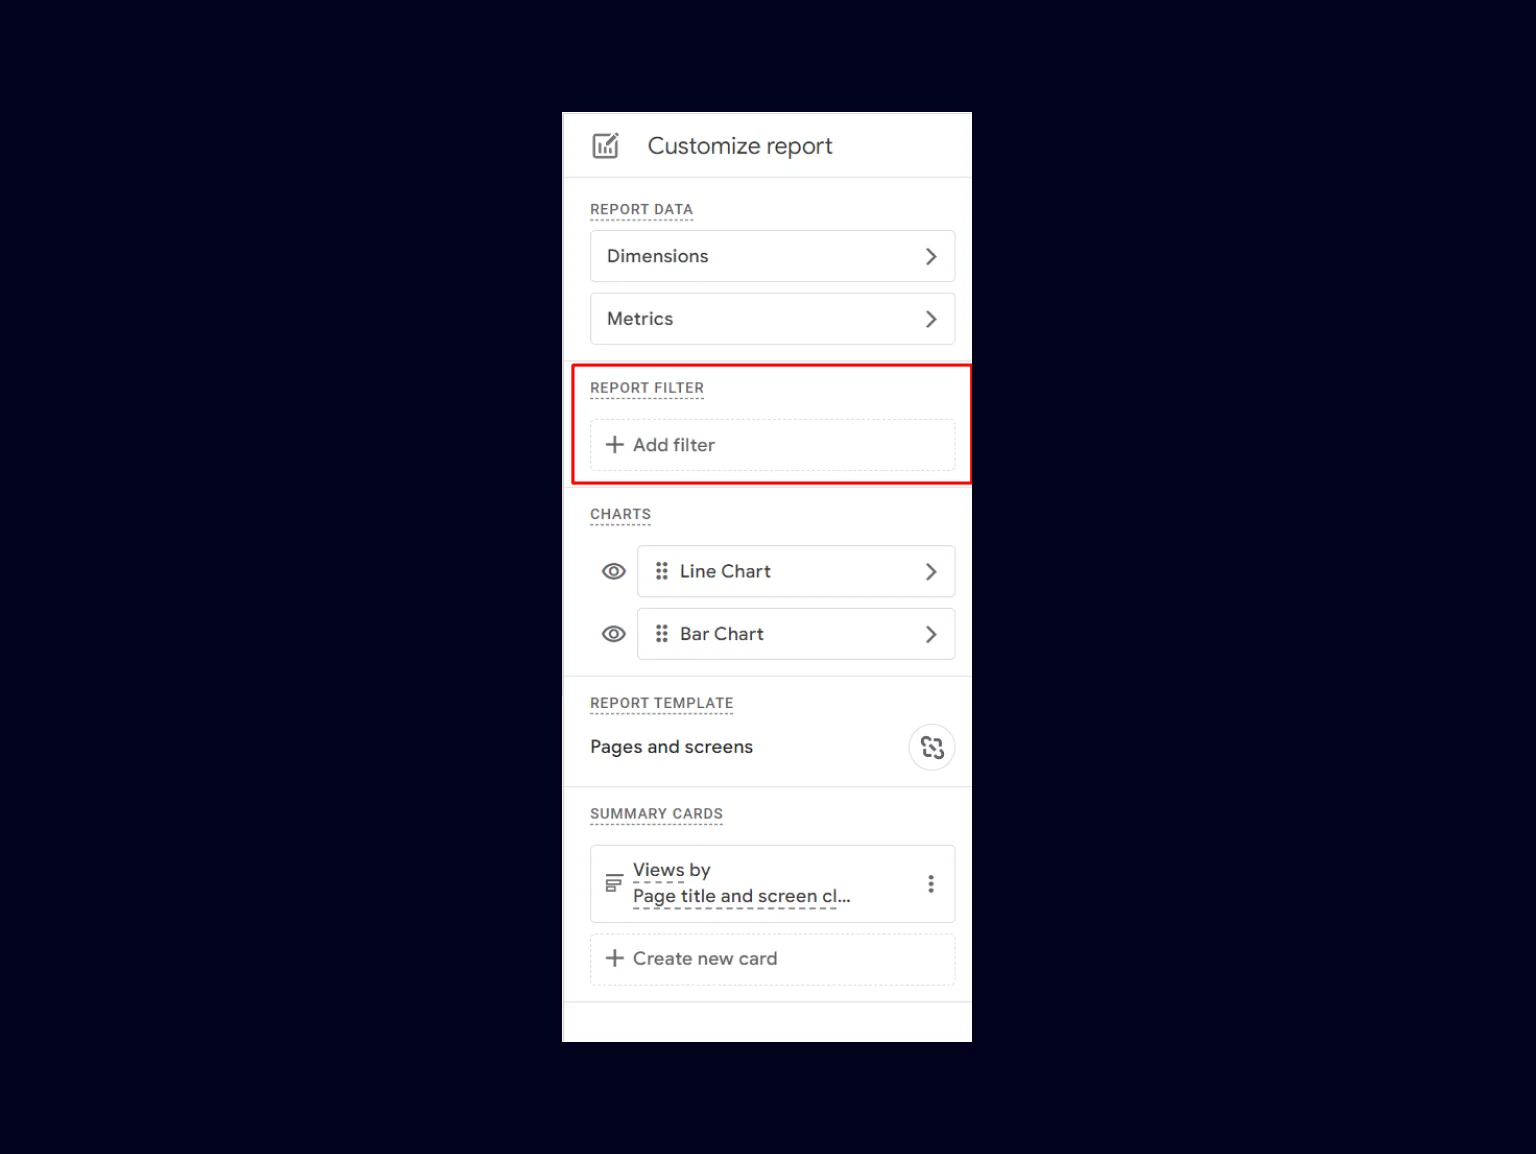
2.For a detail report, there are additional editing options available:
- Report data, where you can choose Dimensions and Metrics;
- Report filter;
- Charts;
- Report template;
- Summary cards.
These parameters in GA4 work great together, allowing you to analyze, customize, and present data in a way that meets specific goals and user needs.
Step 4: Save the report.
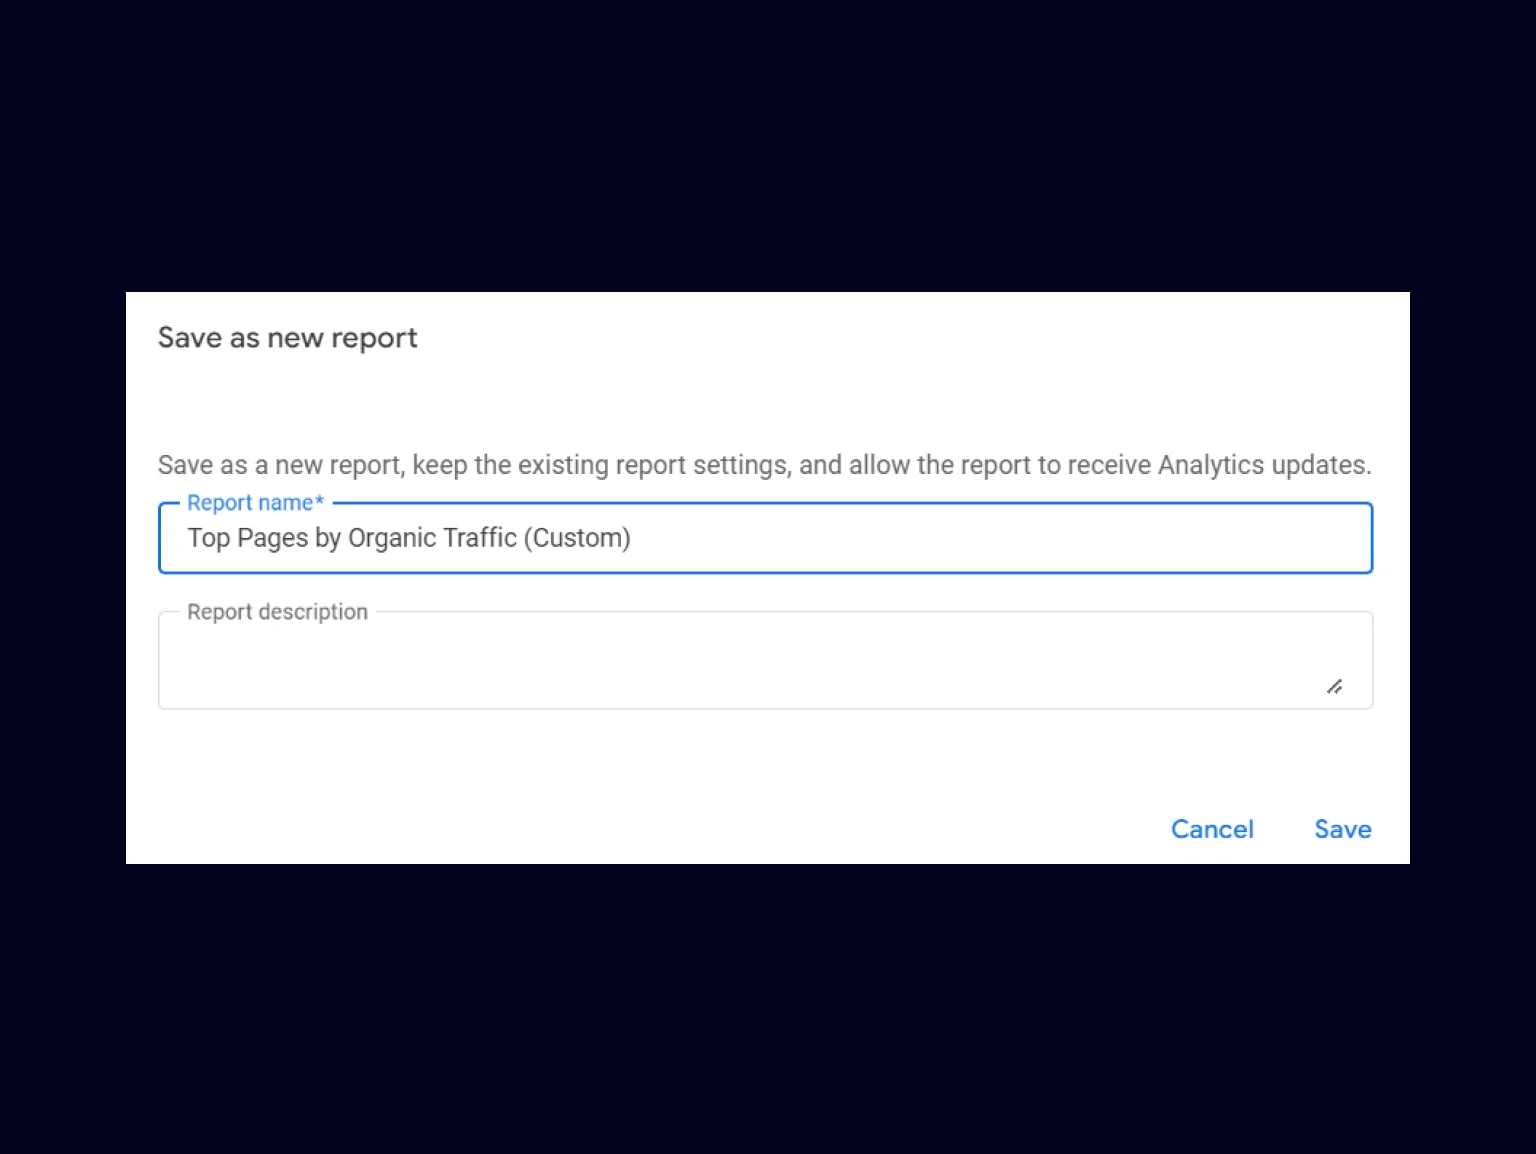
After making all changes, be sure to save the report. This can be done by clicking the Save button in the upper right corner. It’s better to save “as a new report” to make sure you won’t lose old reports and the important information they contain.

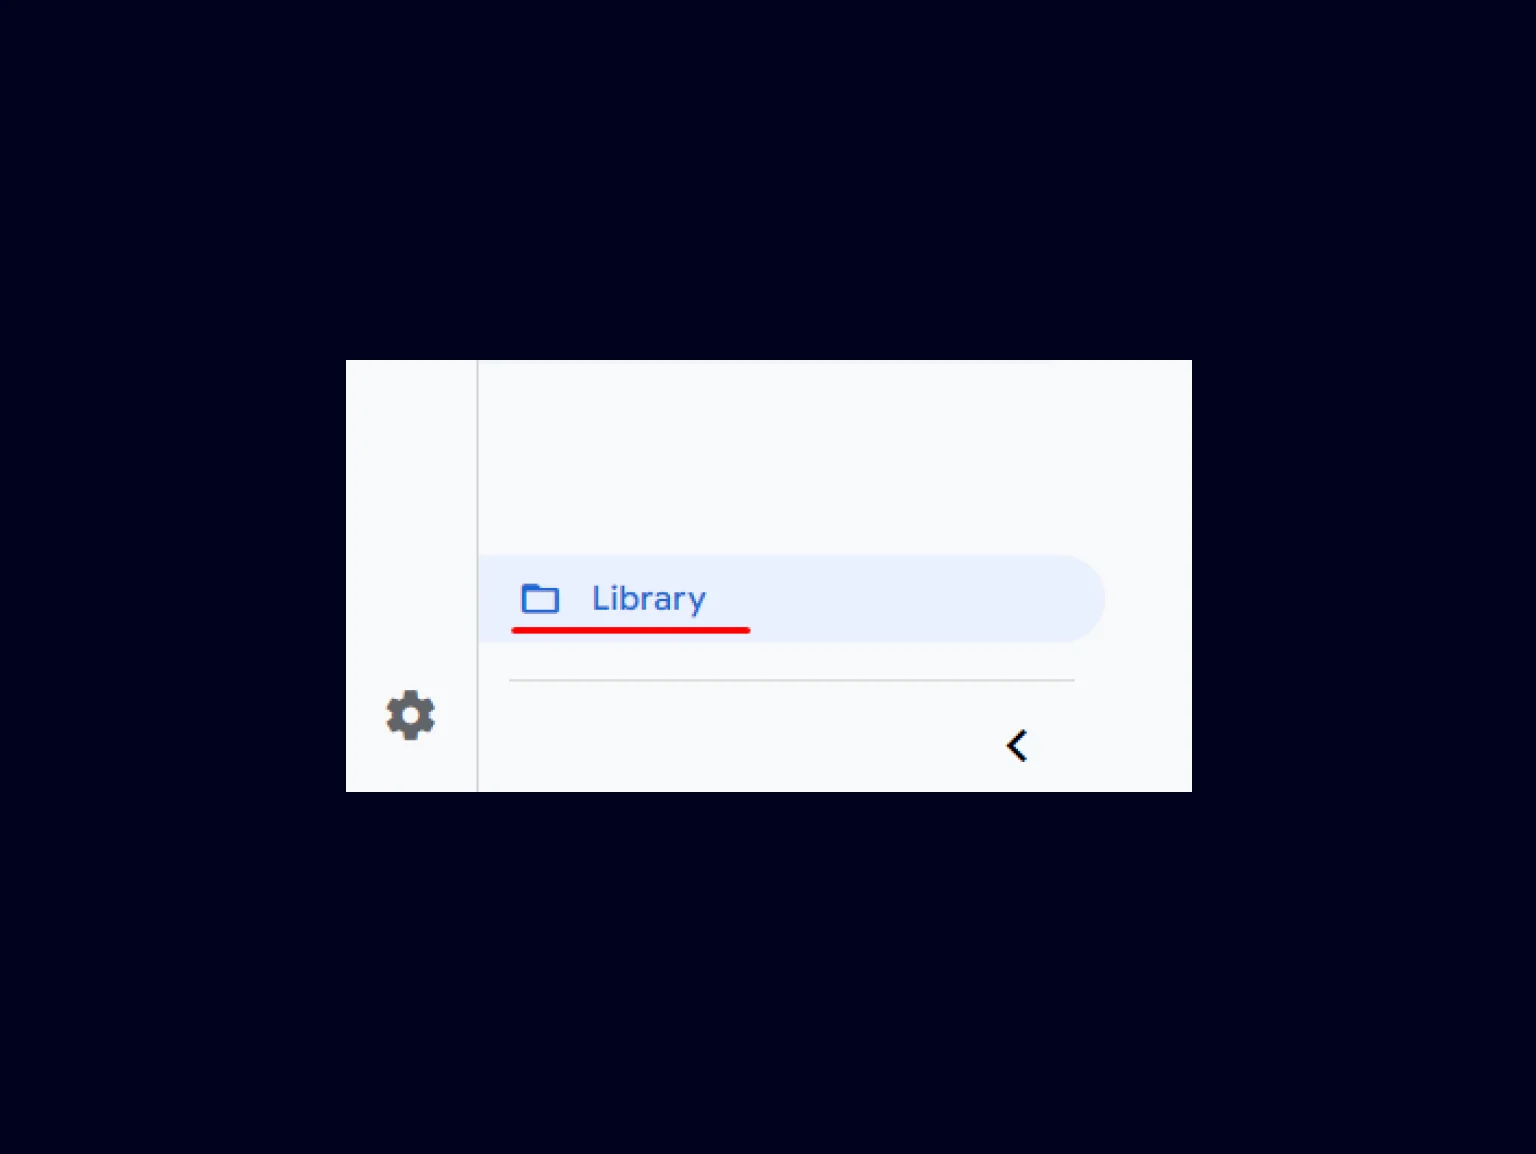
Library
The Library section serves as a control panel for standard and personal reports. In this space, you can edit an existing or create a new report, classify reports by topics, and select reports for publication, which can later be seen on the sidebar available to all users.
Sifting through the GA4 library is like hunting for buried treasure in a data maze. It can be surprisingly fun to dig around and set up the information you need, kind of like playing hide-and-seek with irrelevant data. Analytics can be quite engaging.
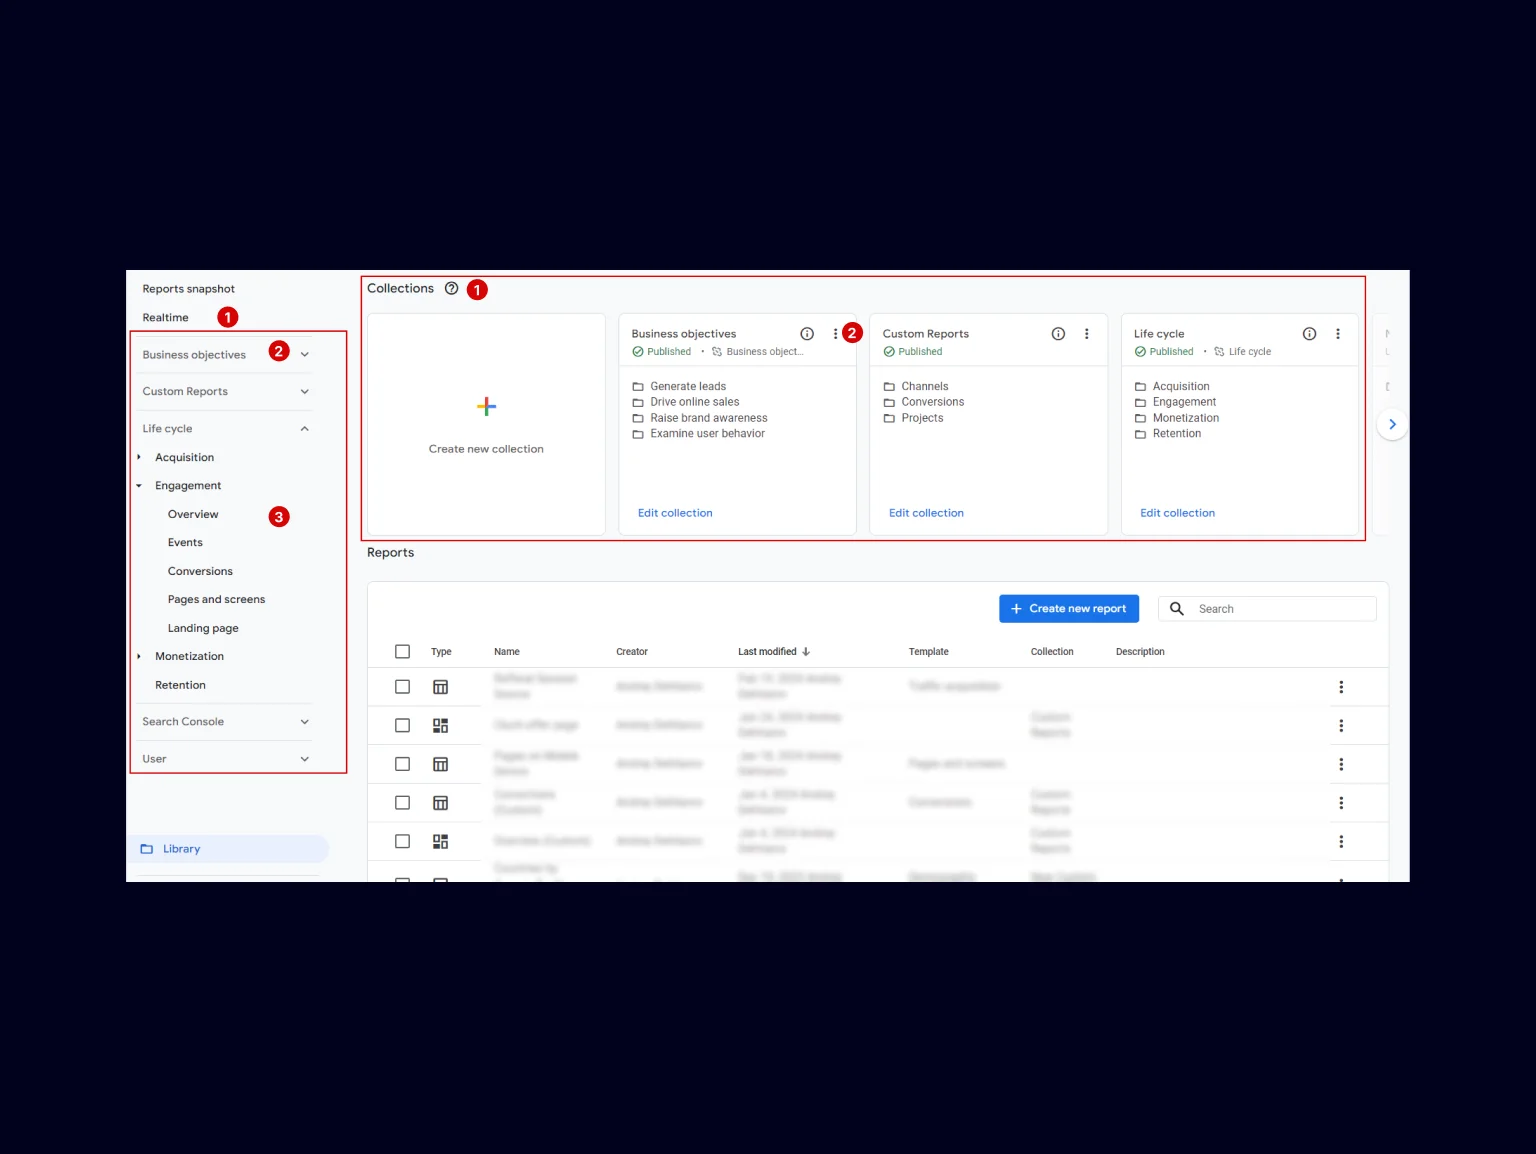
Elements of the Library Section
- Collections. The first level of reports. This level displays report collections. By default, there are 3 collections: Life cycle, Search Console, and User. However, you can later create your own collection of reports based on a specific theme or requirements.
- Themes. One collection can consist of several Themes, making the sorting of reports more convenient and systematic.
- Reports. These are published reports.
Creating new reports
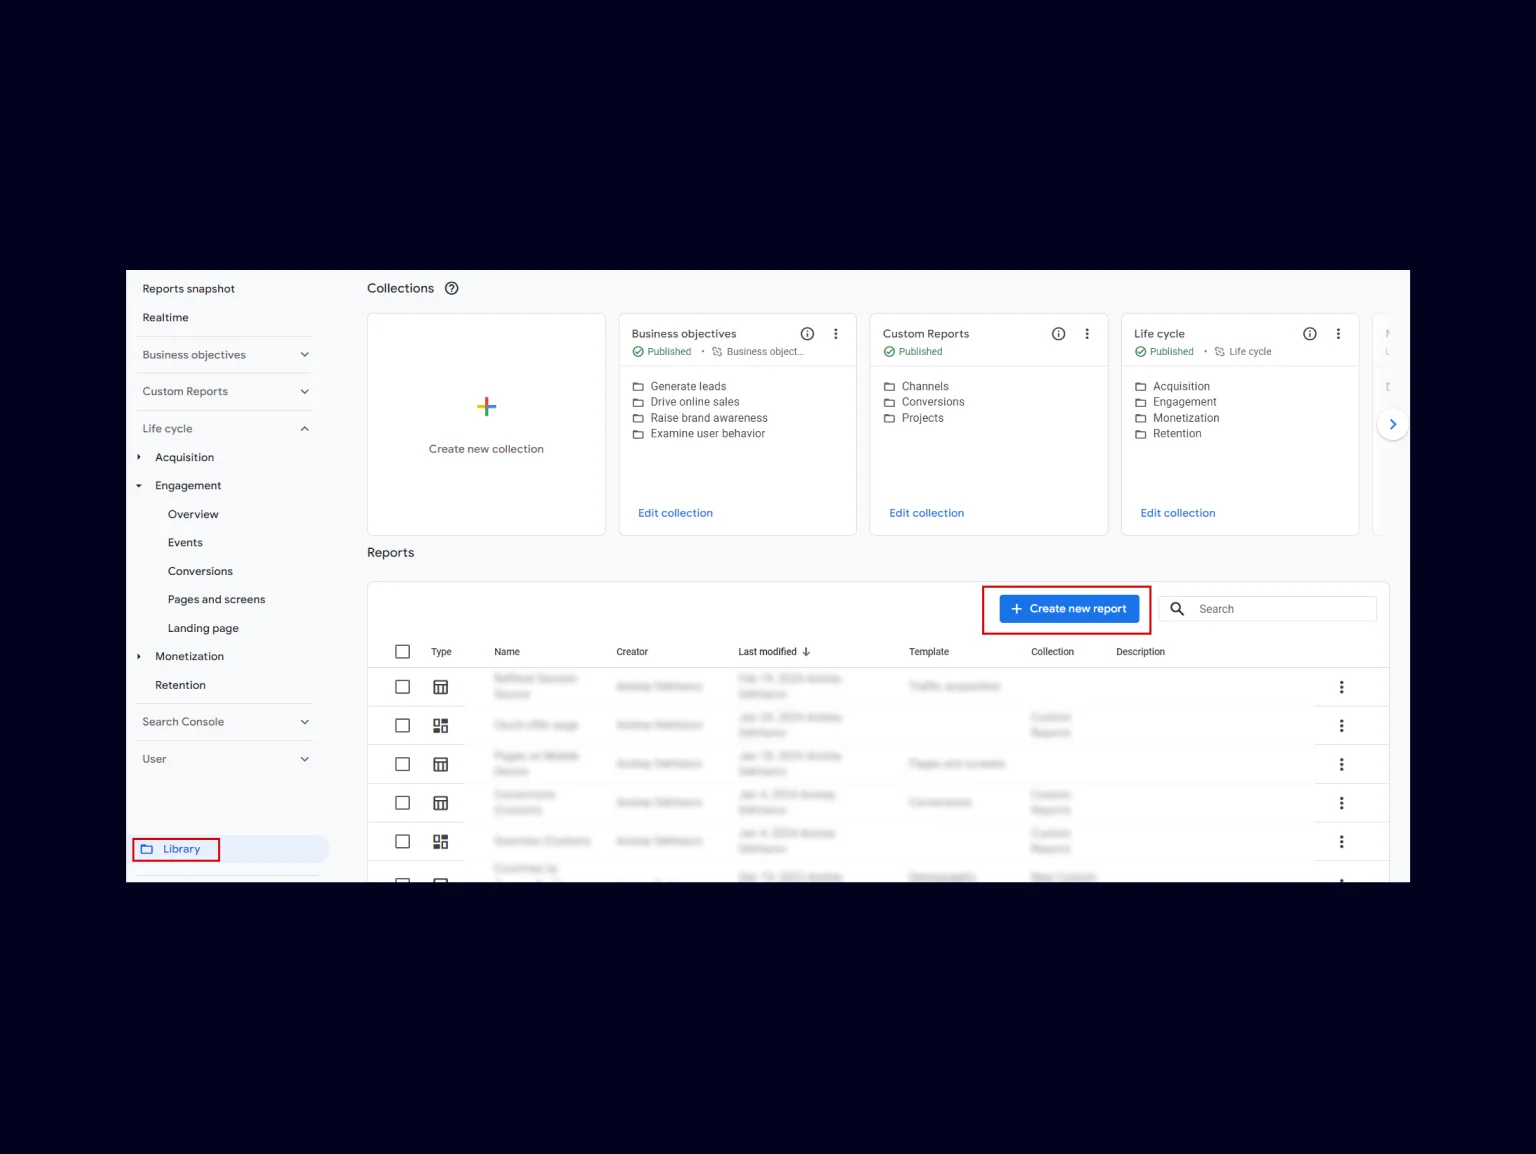
For crafting a report entirely from scratch, head over to the Library panel. Unlike modifying pre-built reports, creating a custom report in the Library unlocks a whole new set of features and advantages, as we’ve already explored.
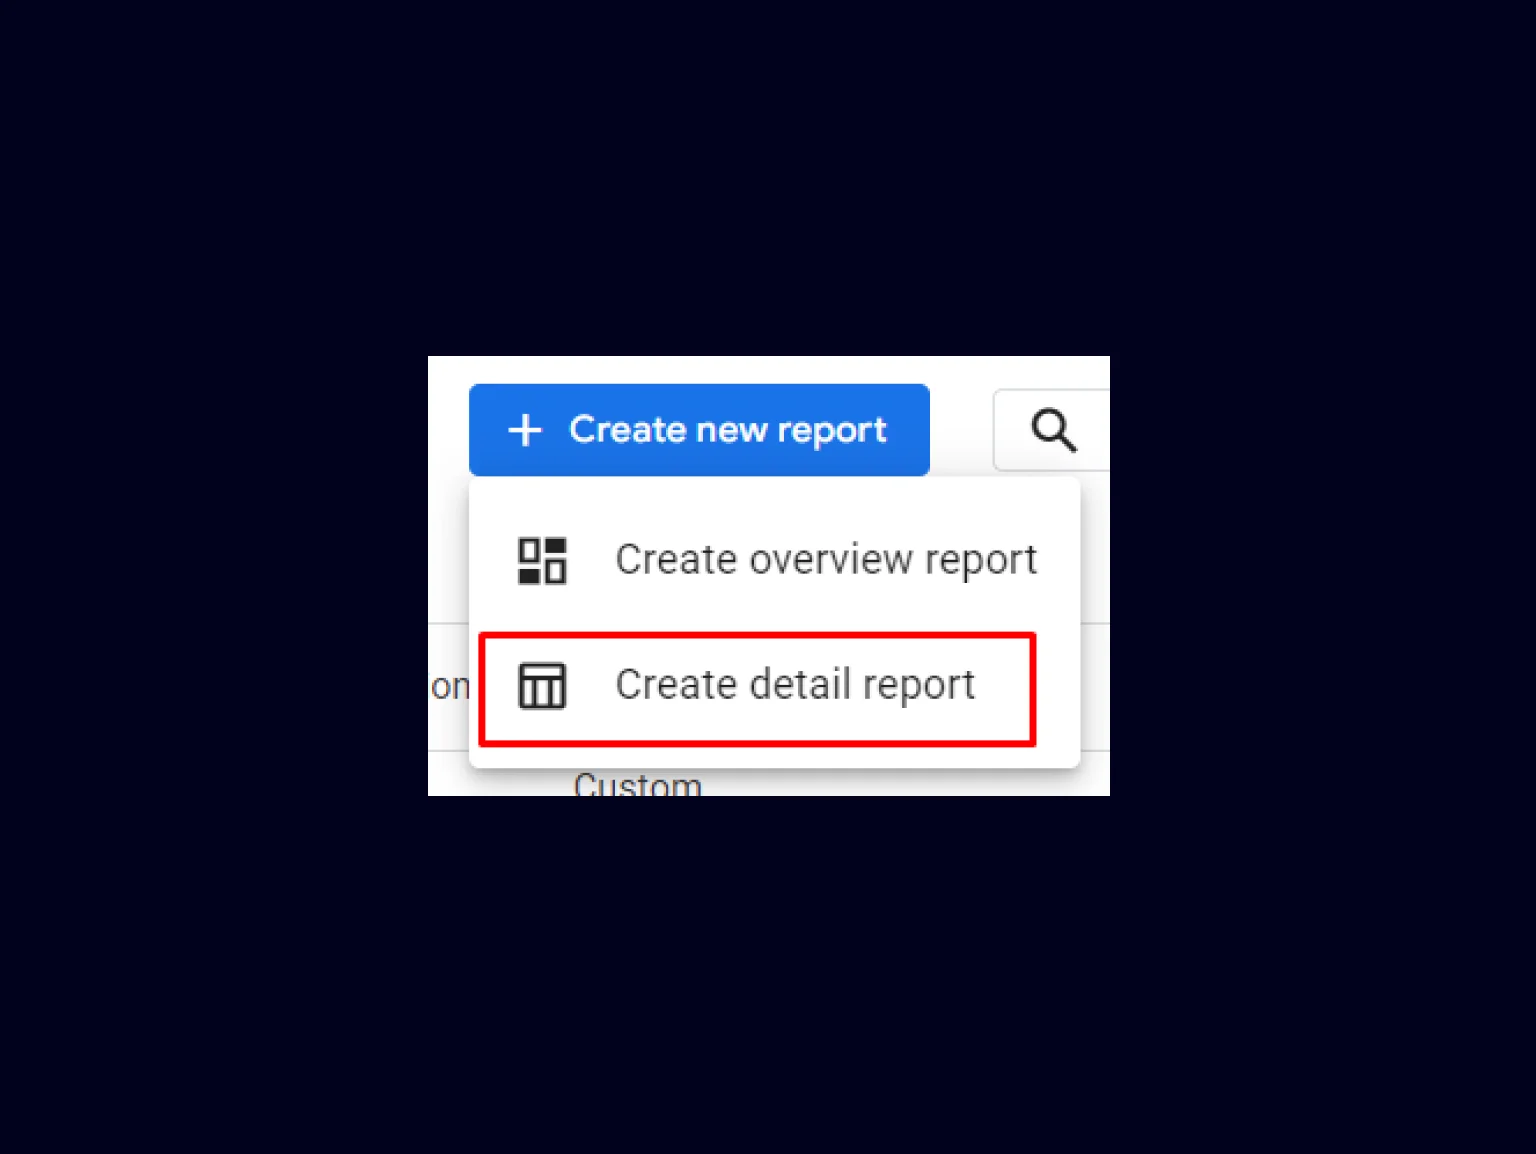
To create a report, click on the Create New Report button and choose one of the dropdown menu options:
- Create overview report;
- Create detail report.
We are focusing on detail reports, so let’s select this option.
A section for creating a new report opens, where you can choose a thematic report template or create a new template from scratch for a personal report. Each option has the same functionality but different initial settings.
Collection settings
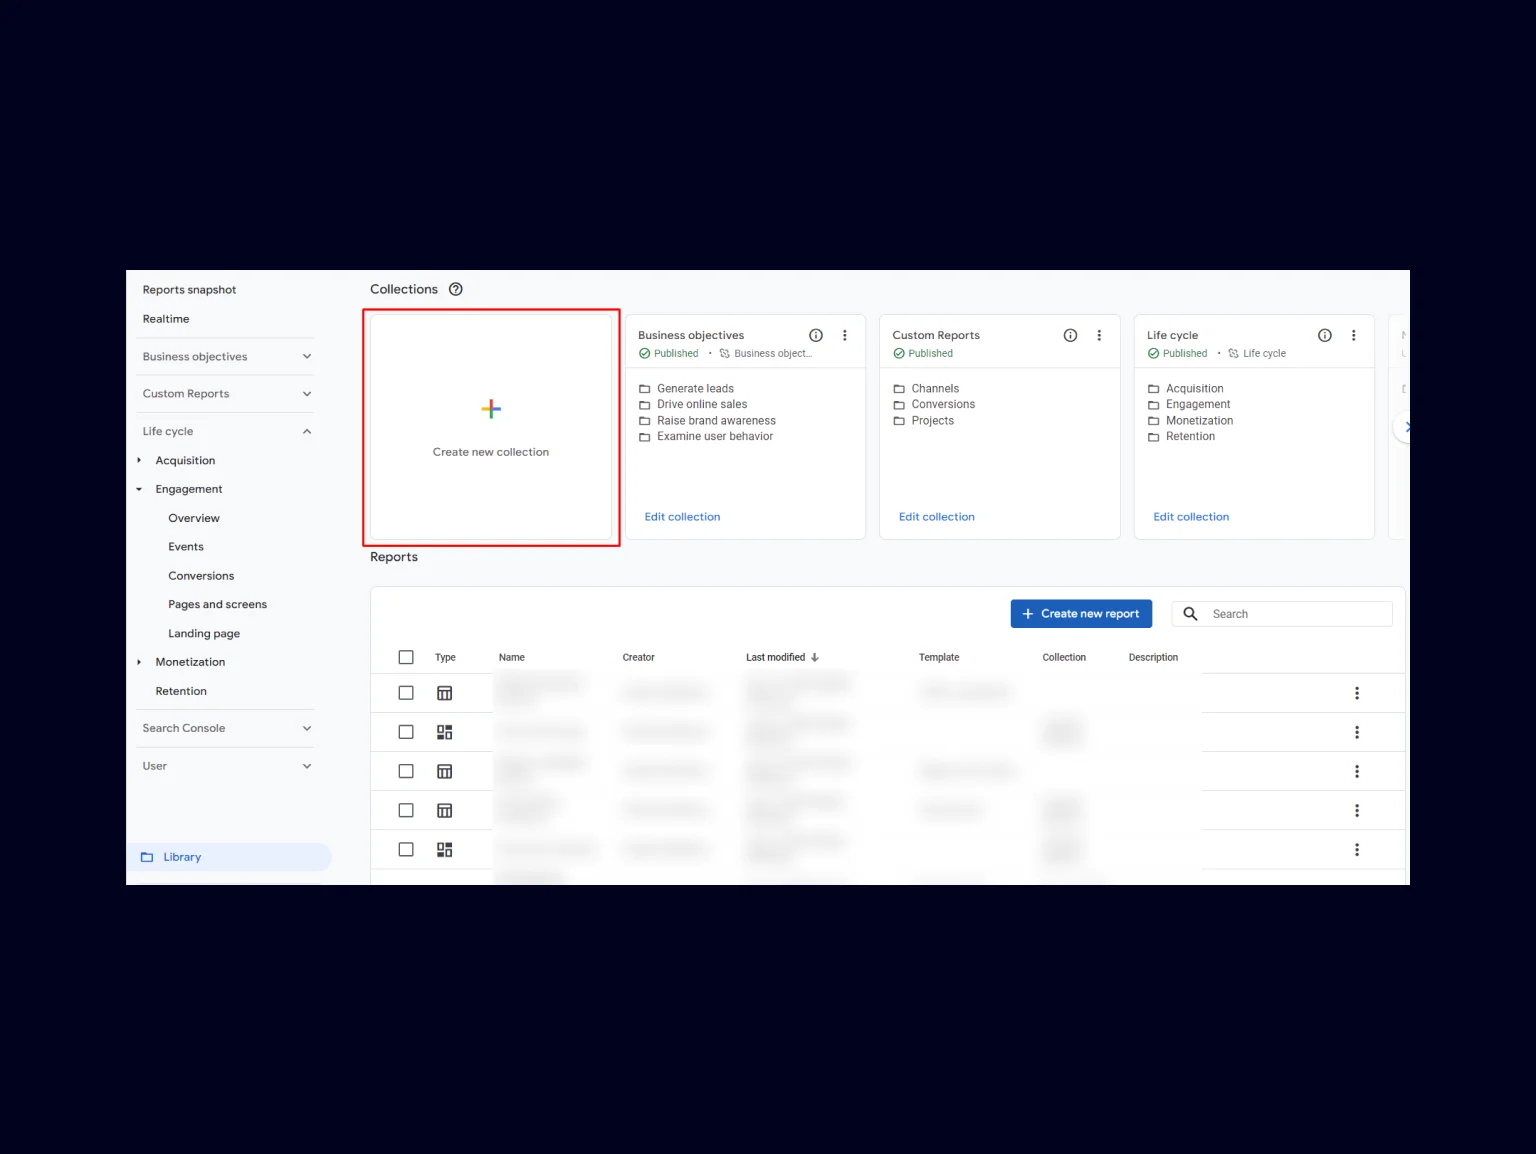
Creating a new Collection of reports is quite simple. Go to the Library section and find the Create new collection button.
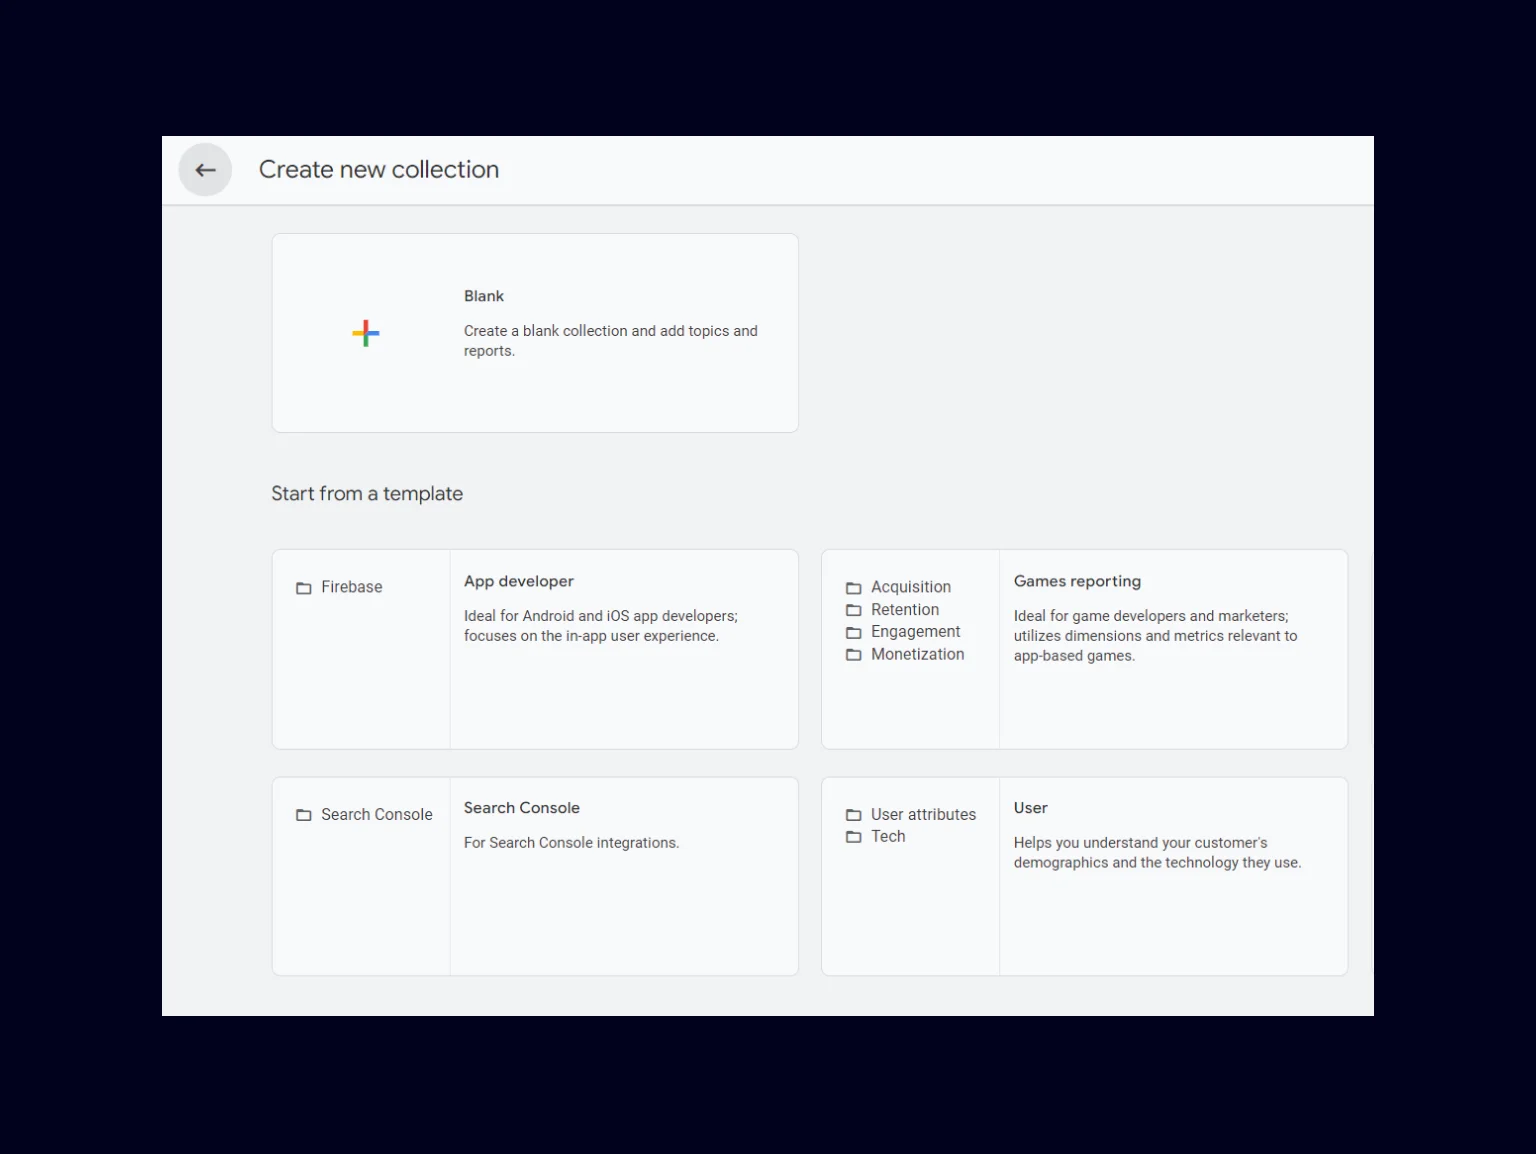
Next, you can choose a collection template or create an entirely new one. For our purposes, we will create a new collection.
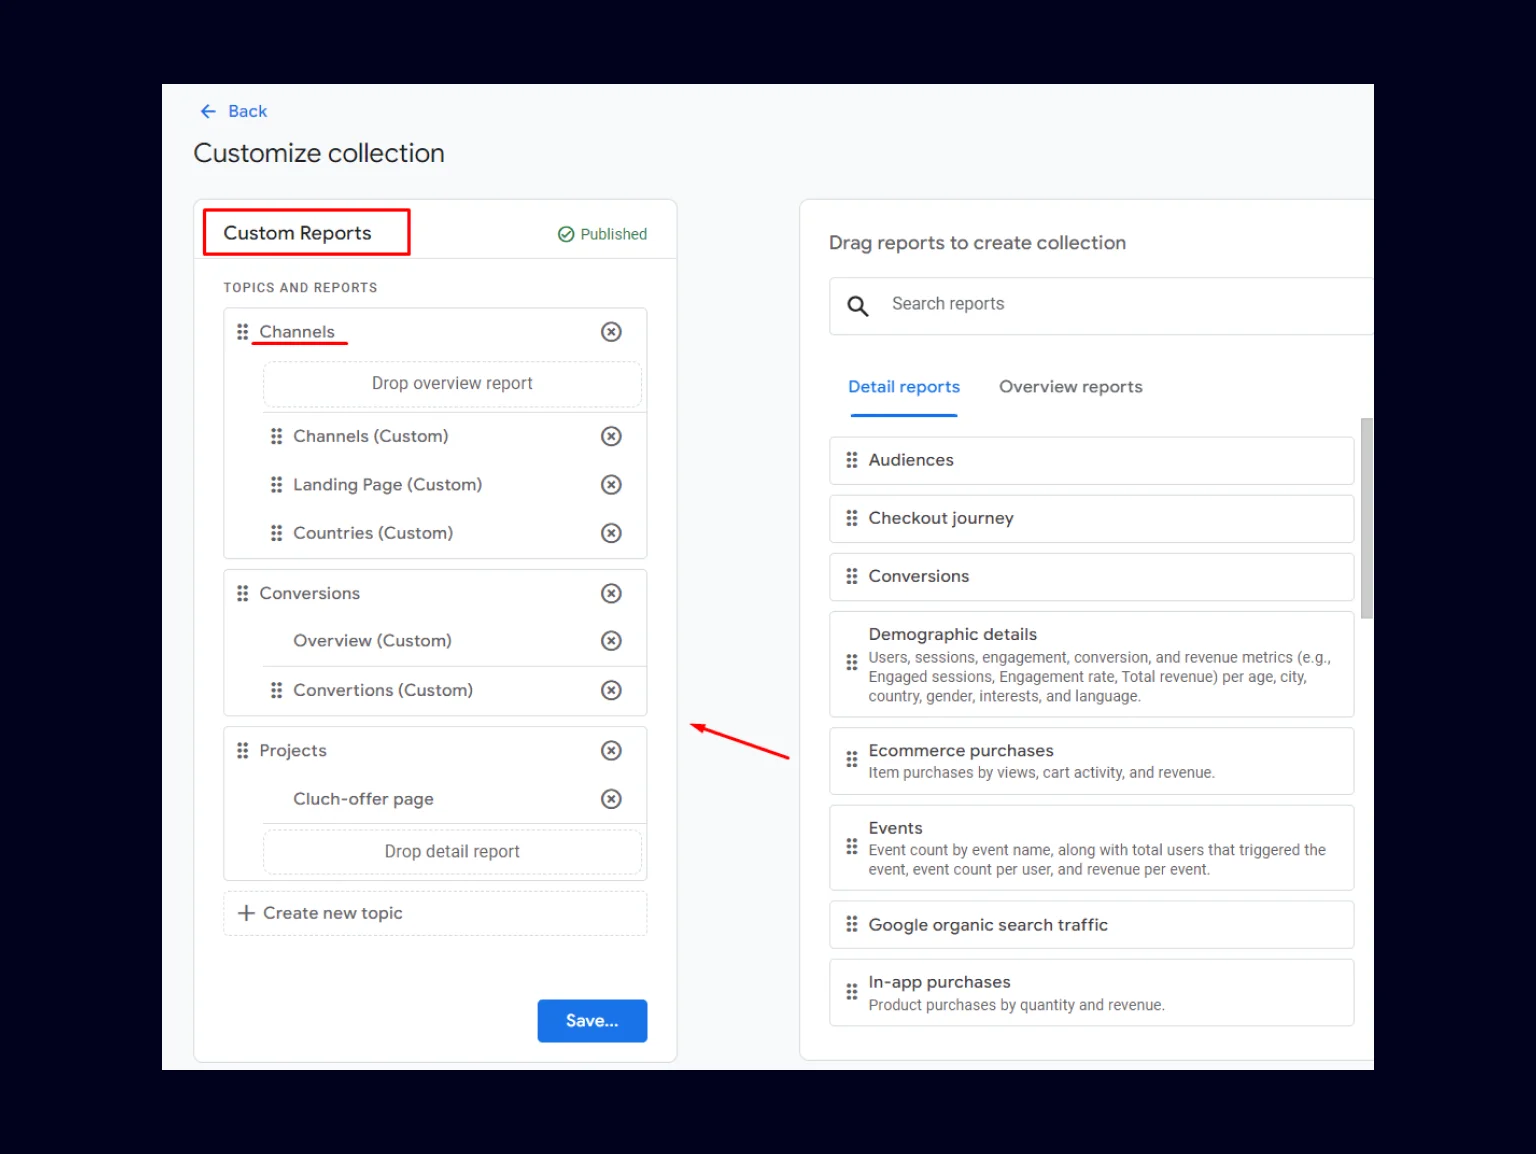
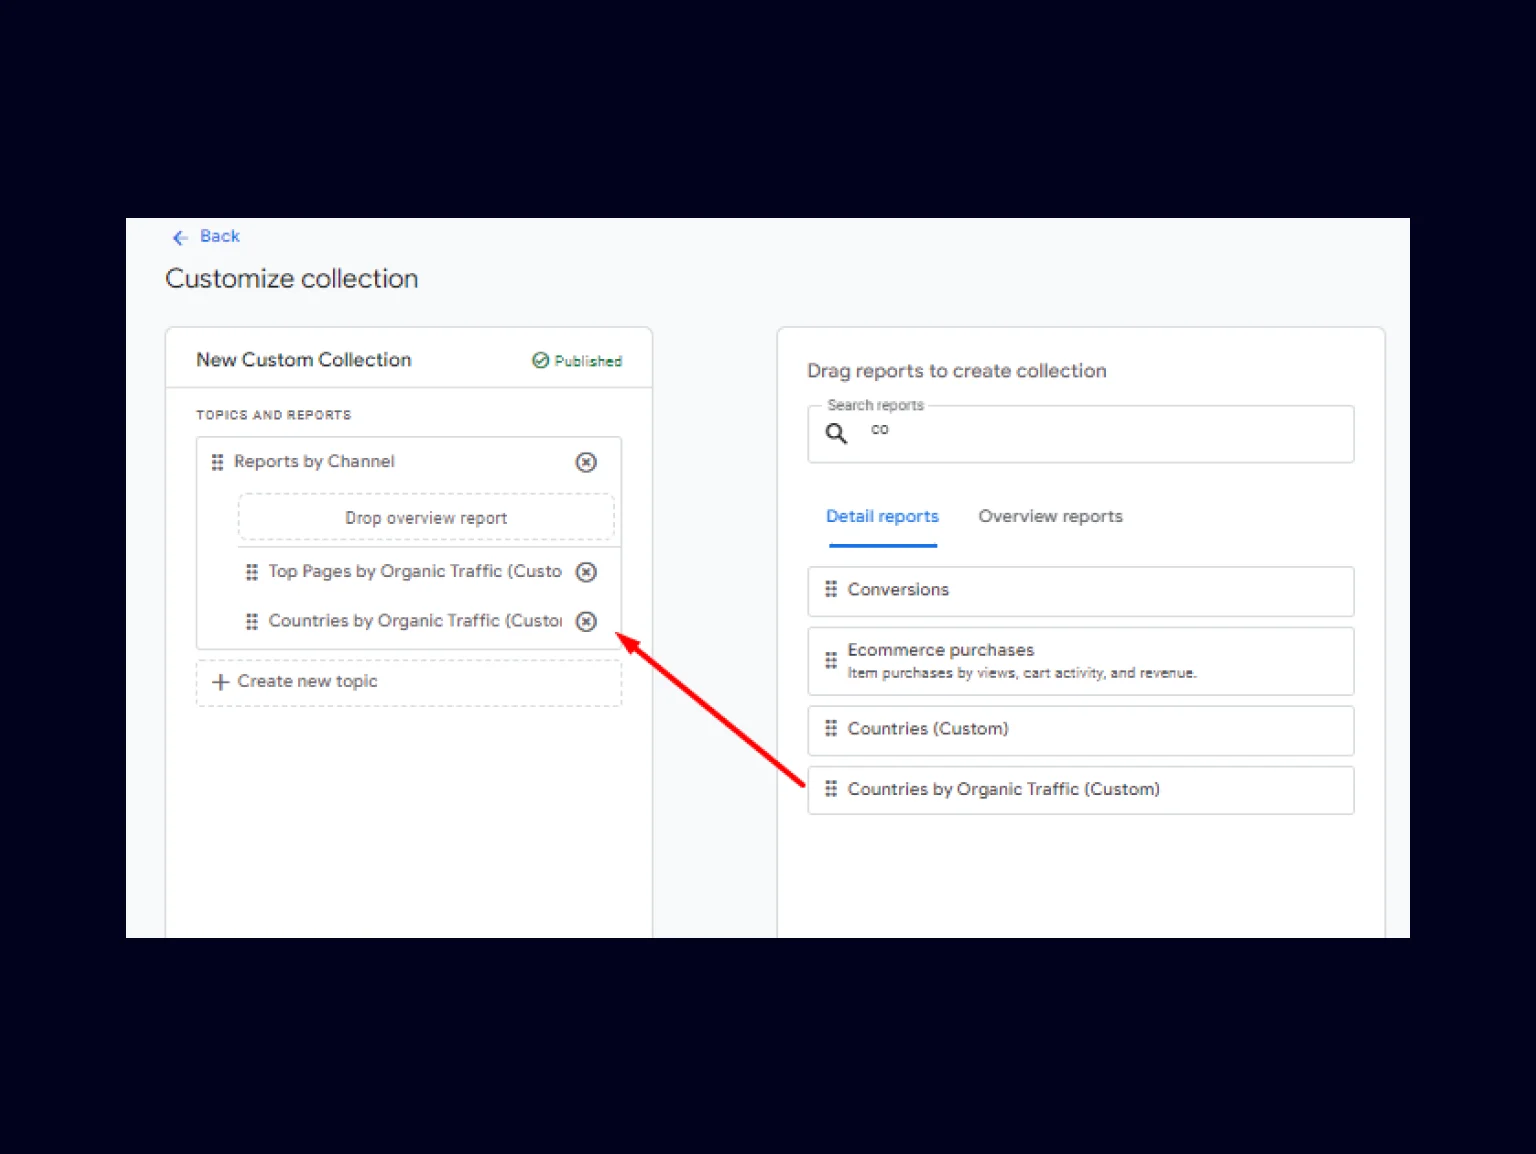
In the new report creation menu, make a new collection name that will be clear and convenient for further navigation through the collections. Then, create a New Theme in the collection (Report by Channel). This can be done to divide reports into subgroups depending on your goals and tasks.
In the New Theme, add a previously created detail report. It can be found in the right panel by typing the report name in the search bar. Both detail and overview reports can be added to the collection, creating a report panel for your convenience.
Once all the changes are made, be sure to save them.
Now our new collection appears in the Library but is not published yet. At this point, you have the opportunity to curate the collection, selecting the necessary reports and editing them without enabling public access.
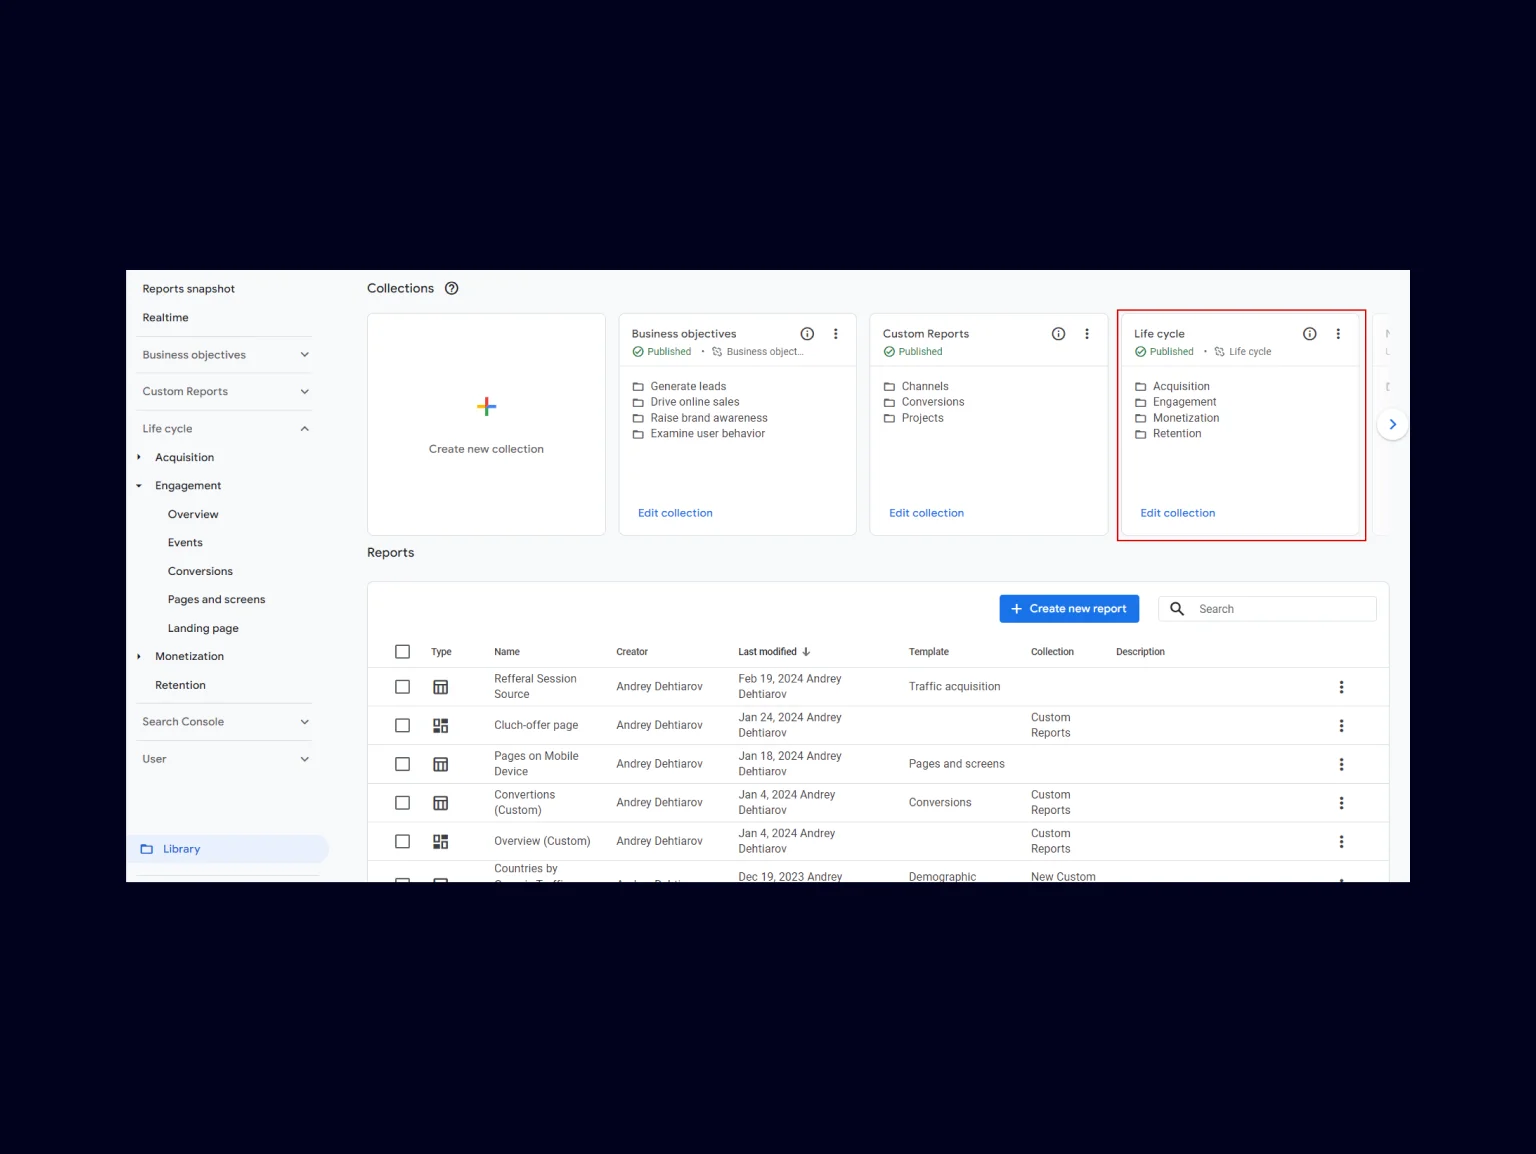
To publish the Collection, click on the Settings icon and select Publish from the dropdown menu. Afterward, the Collection with all its contents will be available on the left side of the report management panel for everyone who has access to your GA4 account.
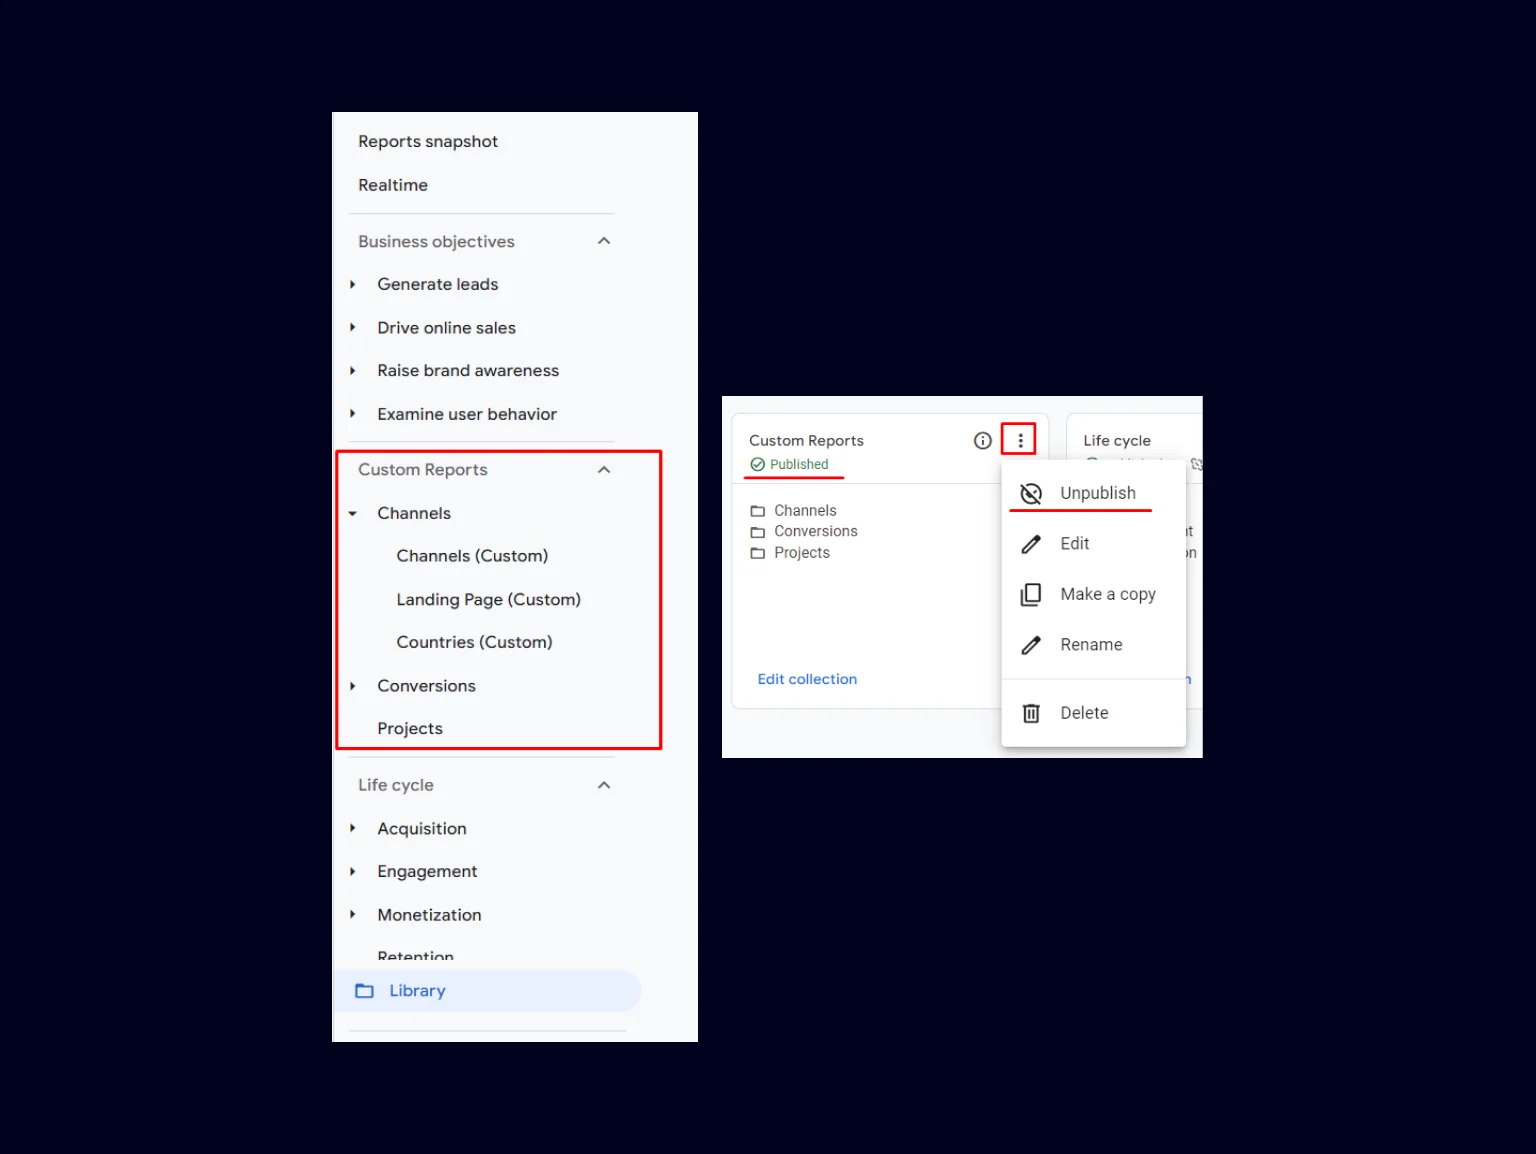
If a Collection is no longer needed, it can be deleted, but the reports contained within it will not be removed.
Example of creating a customized report
Let’s look at the example of creating a new custom report. For this, we will create a new detail report through the Library section, as we’ve already discussed above.
As an example, we’ll create a report for when we need to know and monitor the most visited pages of a site, with traffic coming from organic sources, i.e., search engines. This can demonstrate the effectiveness of SEO campaigns and similar activities.
For this example, we will create a new report based on the “Pages and screens” template. This template is set up to analyze web pages by the number of users, views, average interaction time, and other useful data.
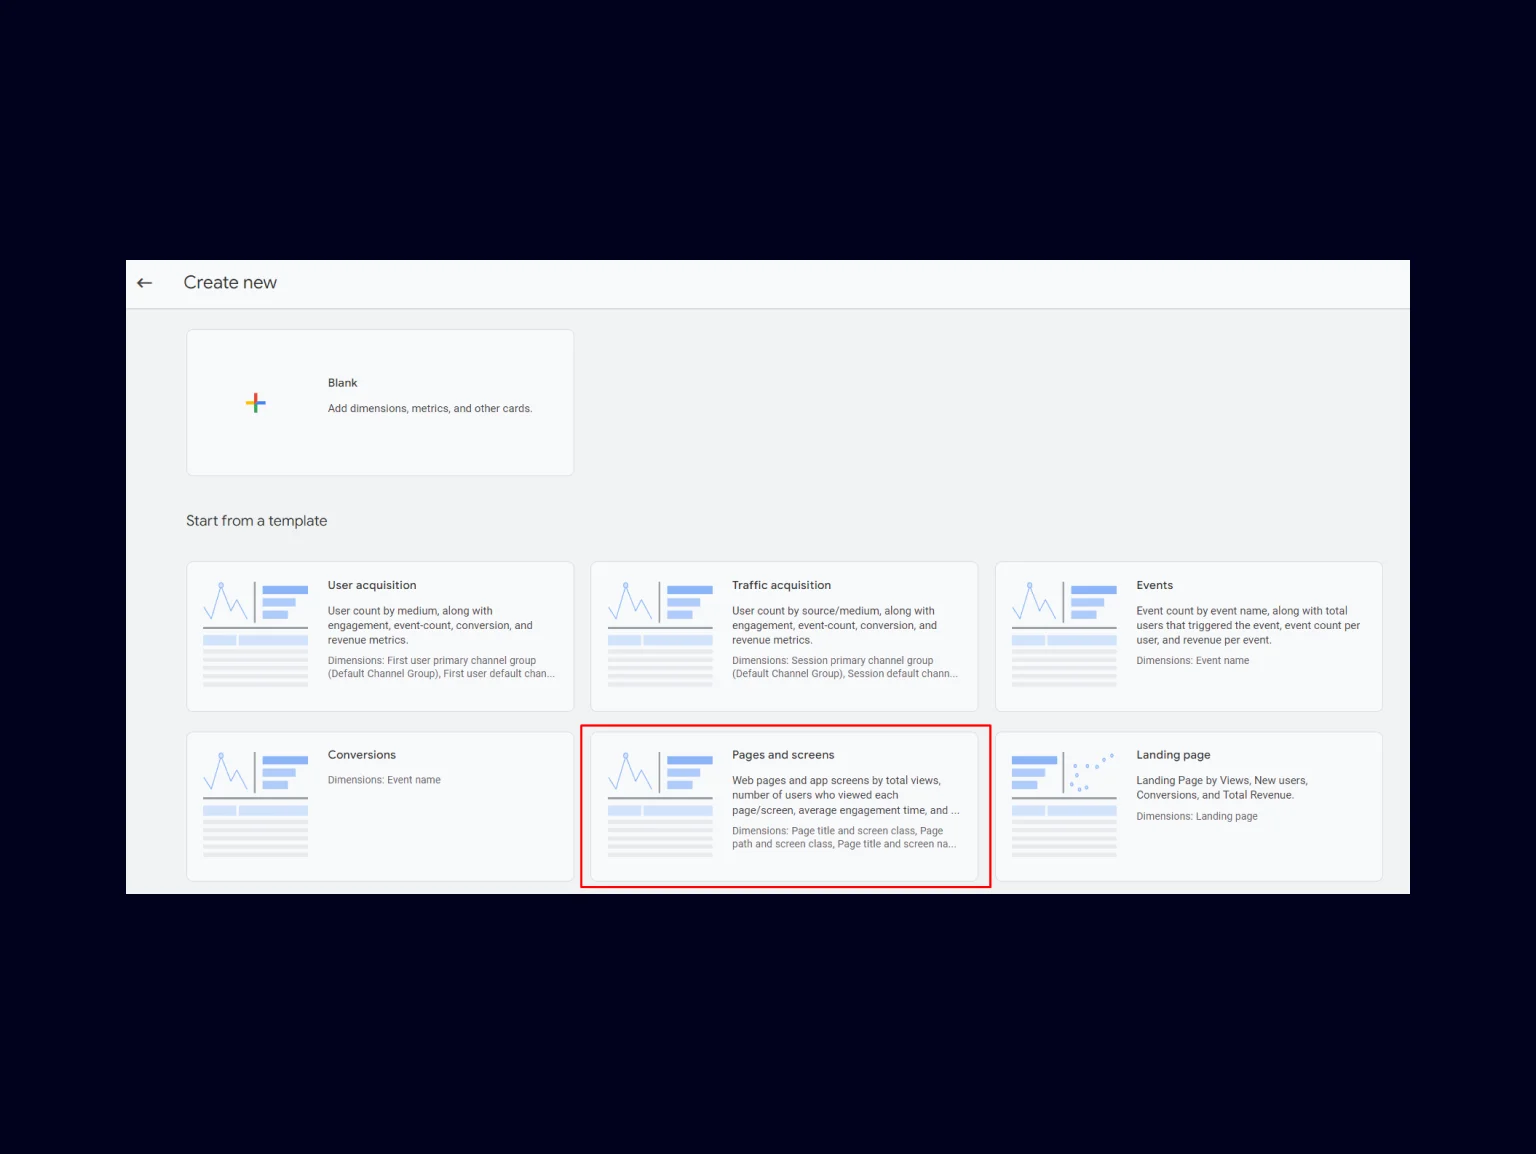
We need to create a report that would show us the top pages by the number of users and other indicators coming from search engines.
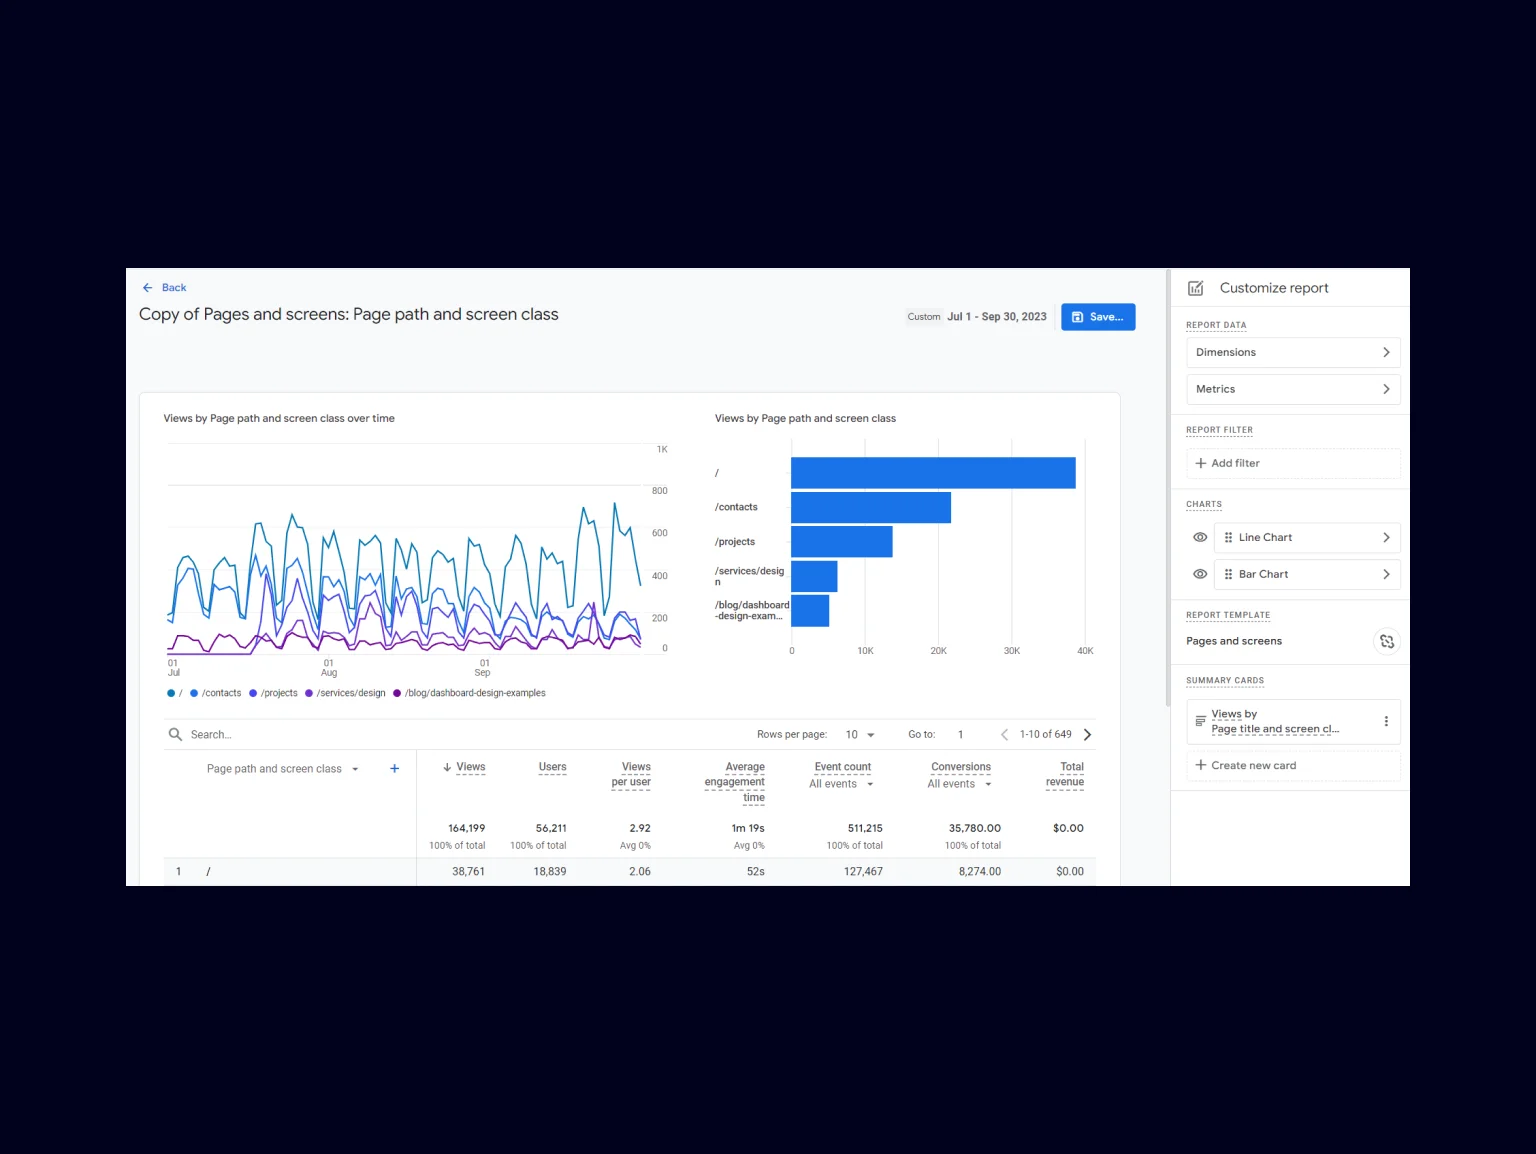
We’re now in the report template, ready to customize it to meet our task requirements.
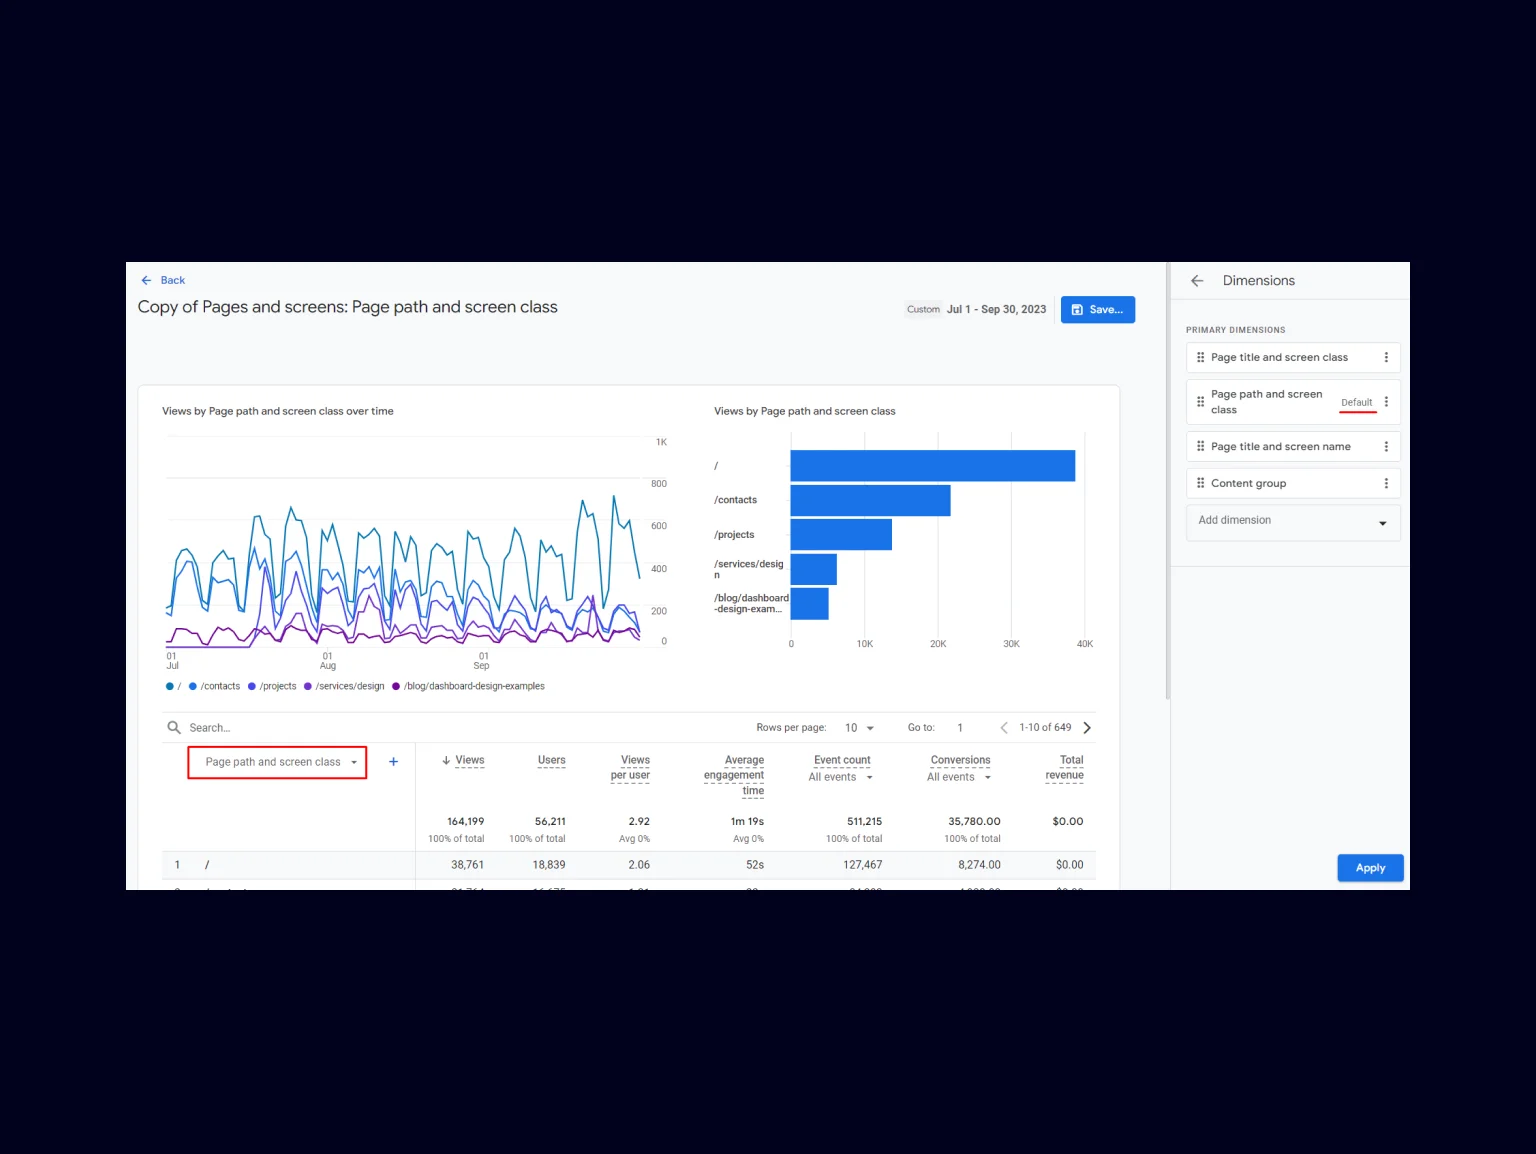
By default, Dimensions are set to Page path and screen class, which suits our report, but these can be added or changed if necessary. Then, change Metrics:
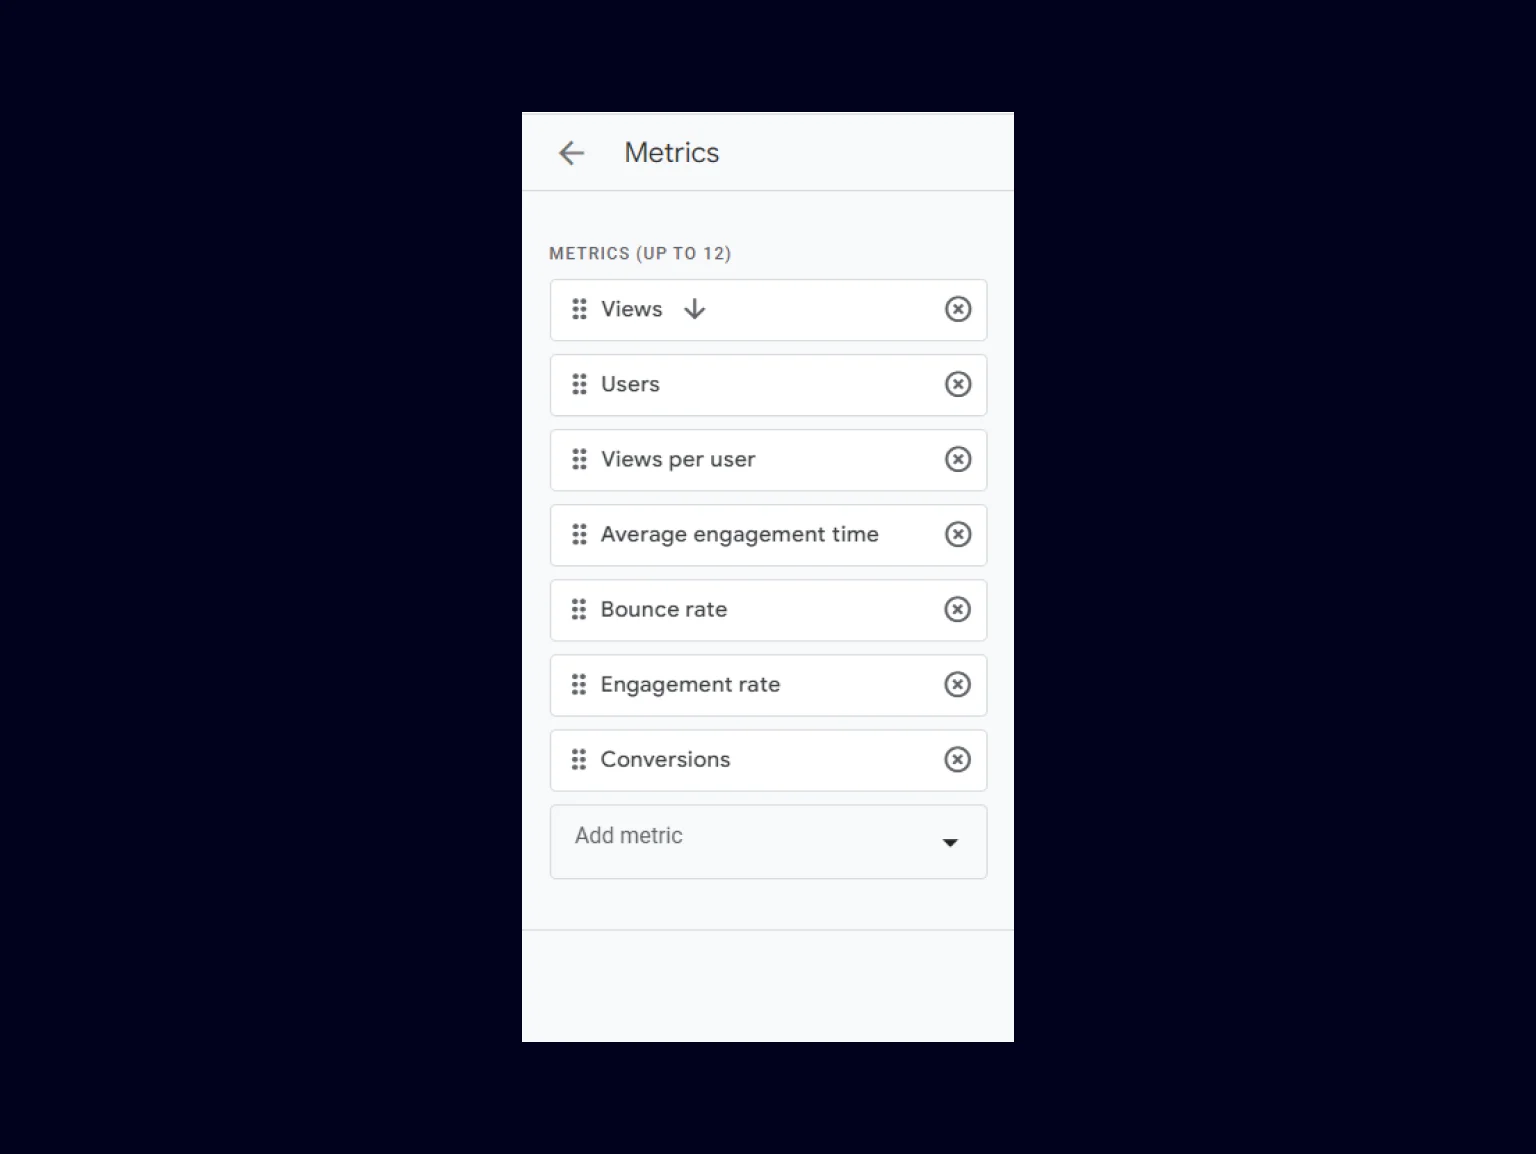
Remove:
- Event count
- Total revenue
Add:
- Engagement rate
- Bounce rate
Next, we will set a filter to specify the traffic channel.
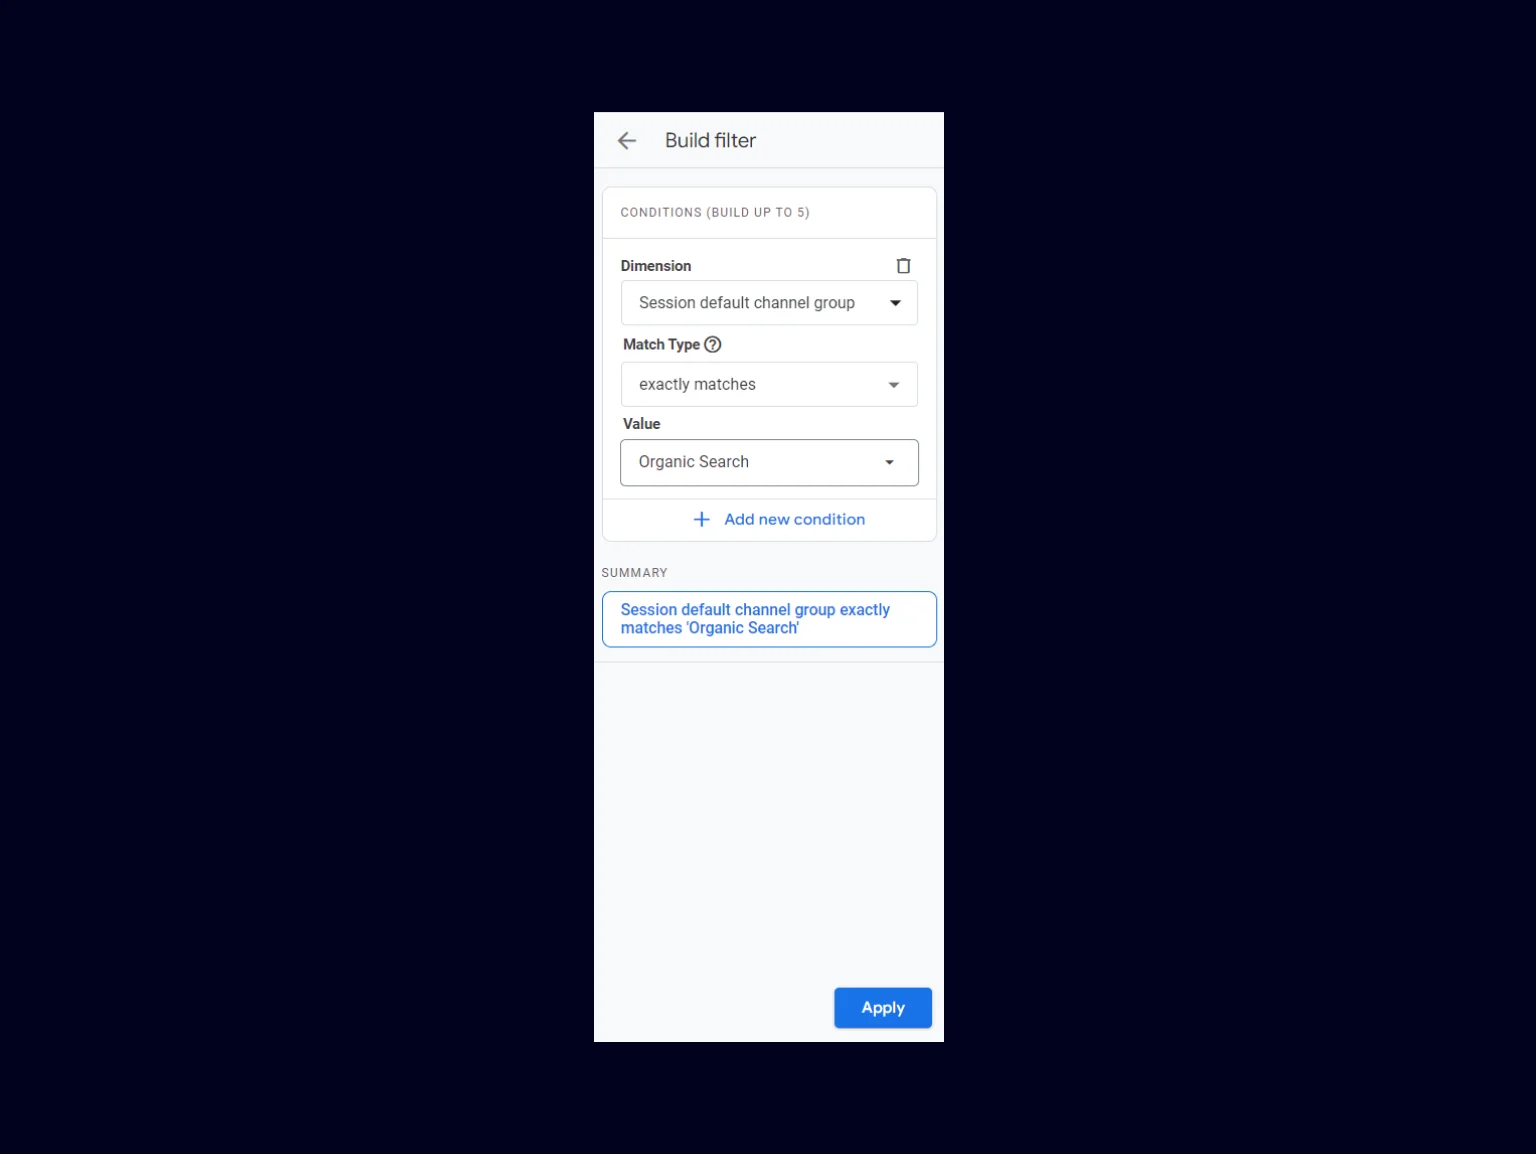
Then, we need to disable one of the charts and keep the link with the template.

Great, we’re almost at the finish line! Now, you can analyze the pages that receive traffic from search engines and make changes to the page or SEO campaign to improve the desired indicators. But this is not the end.
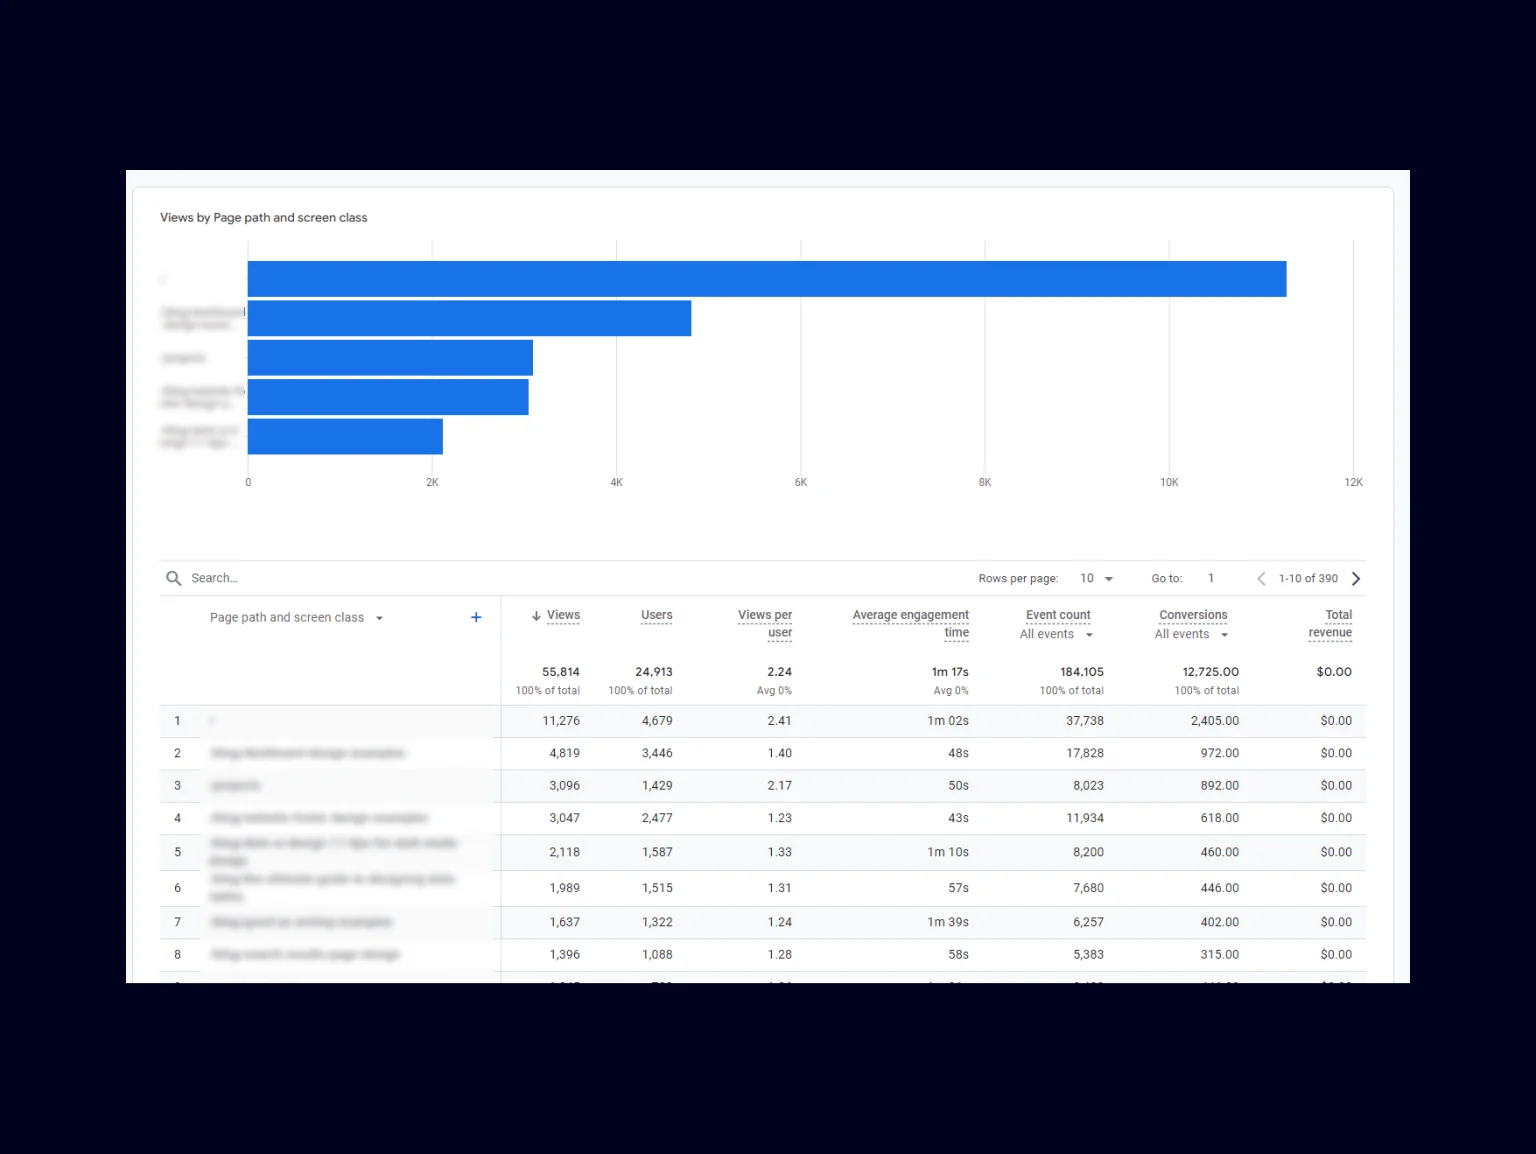
We still need to save and rename the report by pressing the Save button.
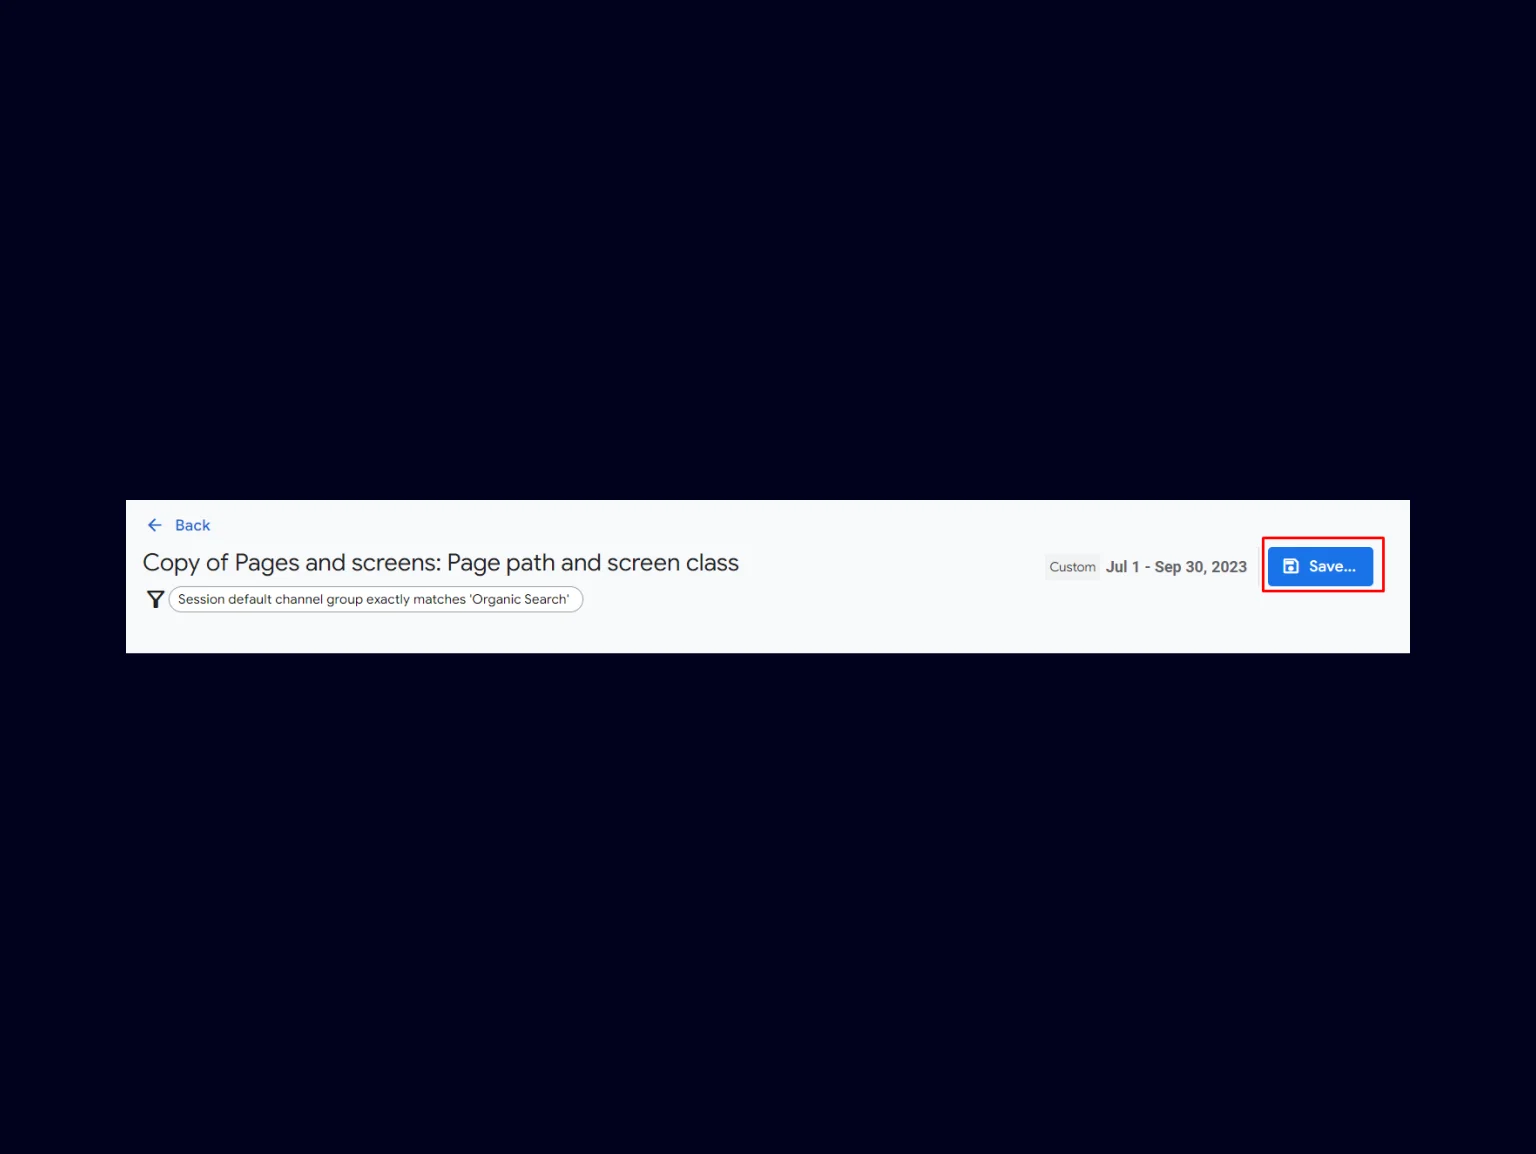
Choose a name that suits you best and hit Save.
Thus, we created our own personalized detail report. In the future, we will place it in the Library and publish for general use.
Custom reports that may be useful to you
Now, we’d like to present a few examples of detail reports that are likely to be beneficial for your business needs. But these can also serve as templates for creating detail reports for your personal tasks.
Organic traffic by country
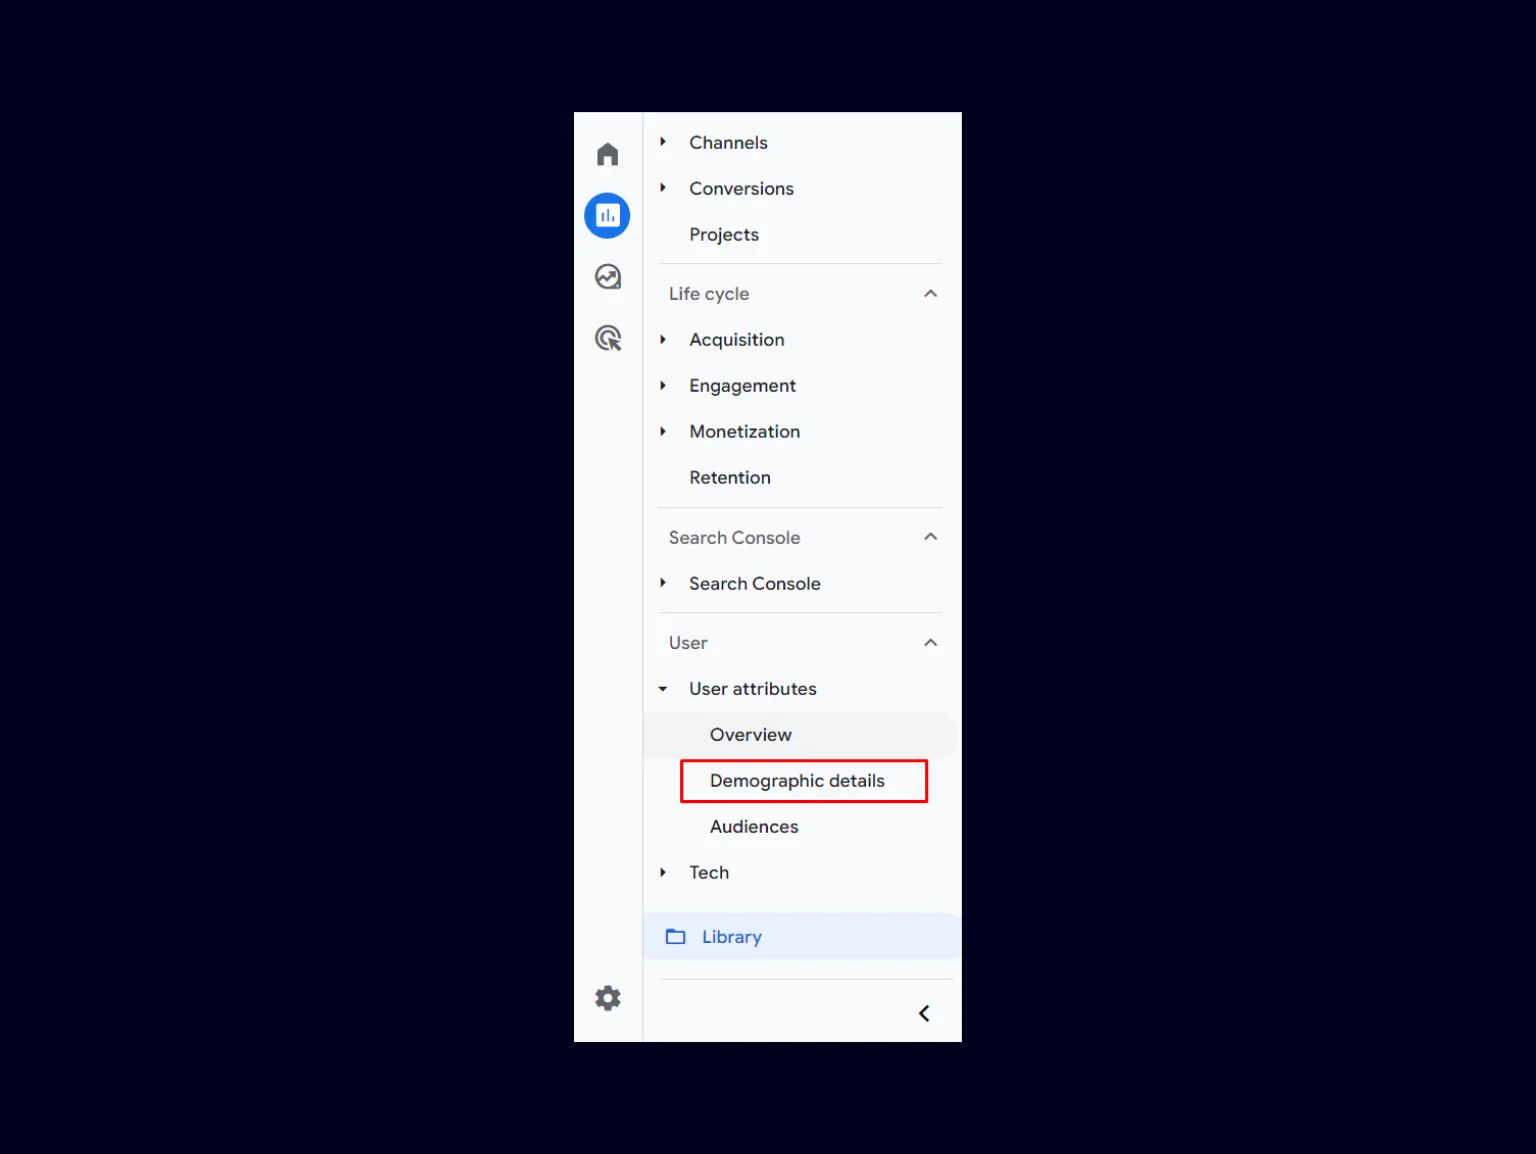
Let’s create a detail report where we can find out the amount of Sessions in different countries received from Organic traffic sources. For this, we can use the ready-made report in the left panel of the Reports > Demographic details section.
By clicking on the Report editing icon, we can start modifying the report for our task. In this example, we’ll add Metric > Sessions.
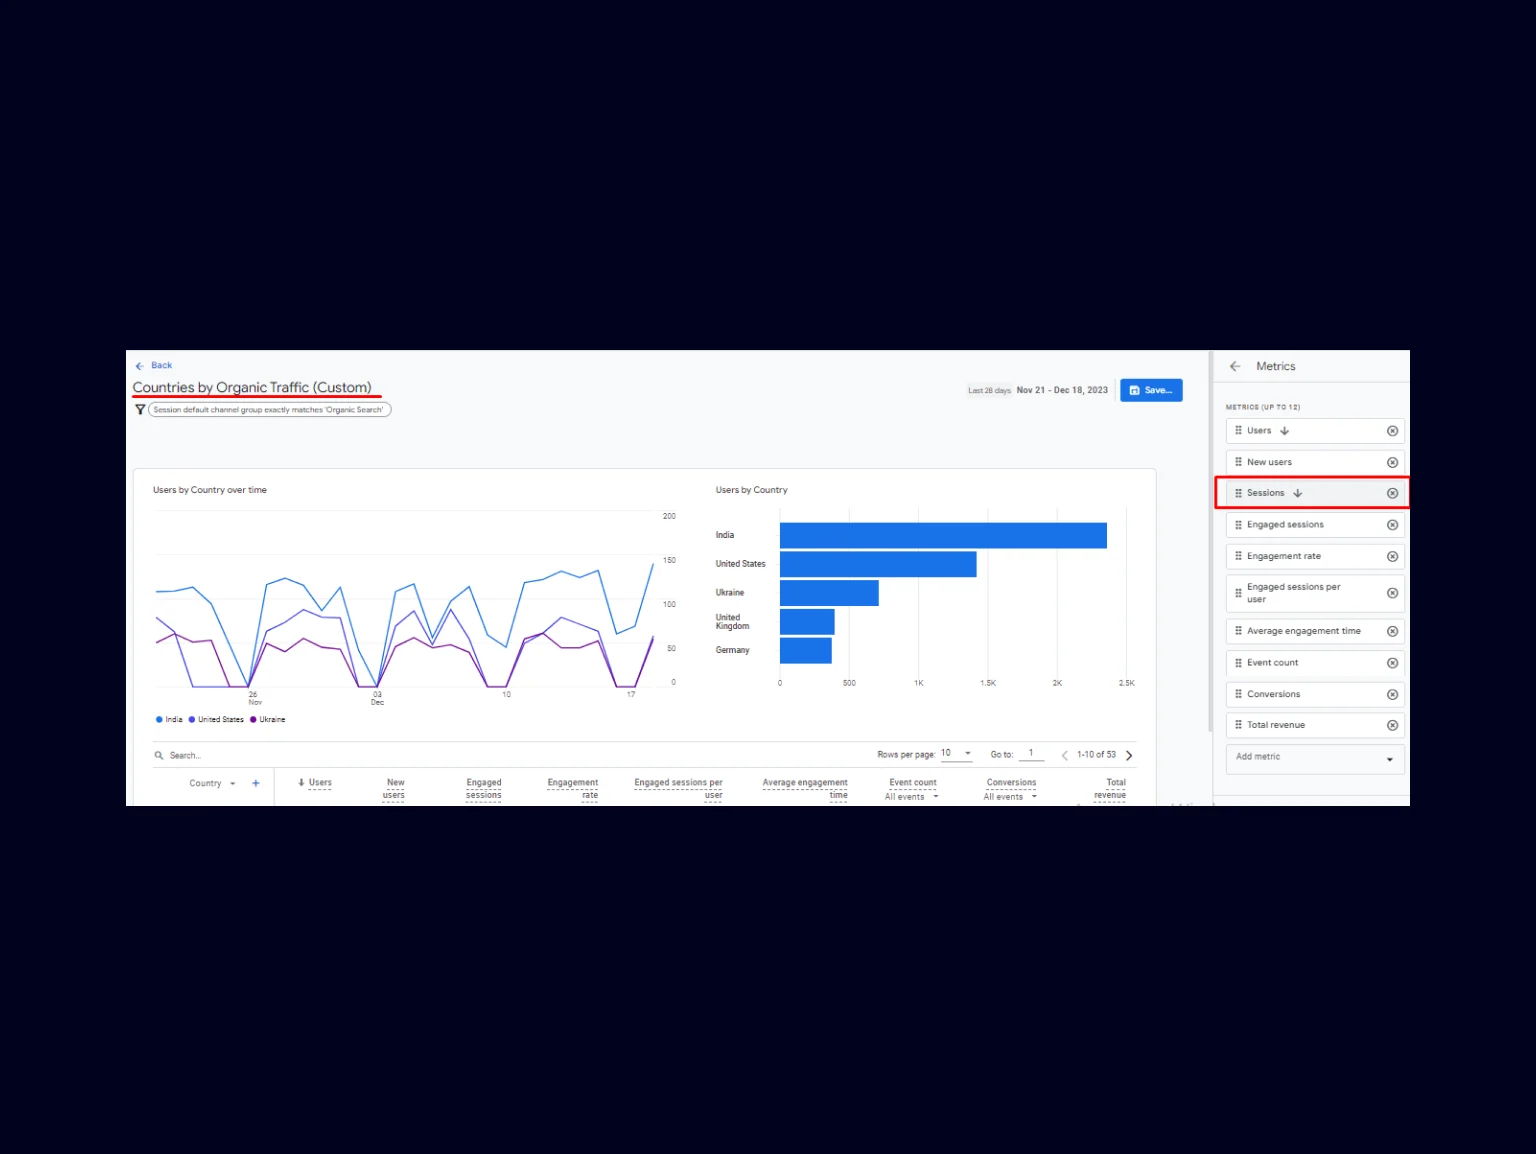
Next, let’s add an Organic Traffic filter.
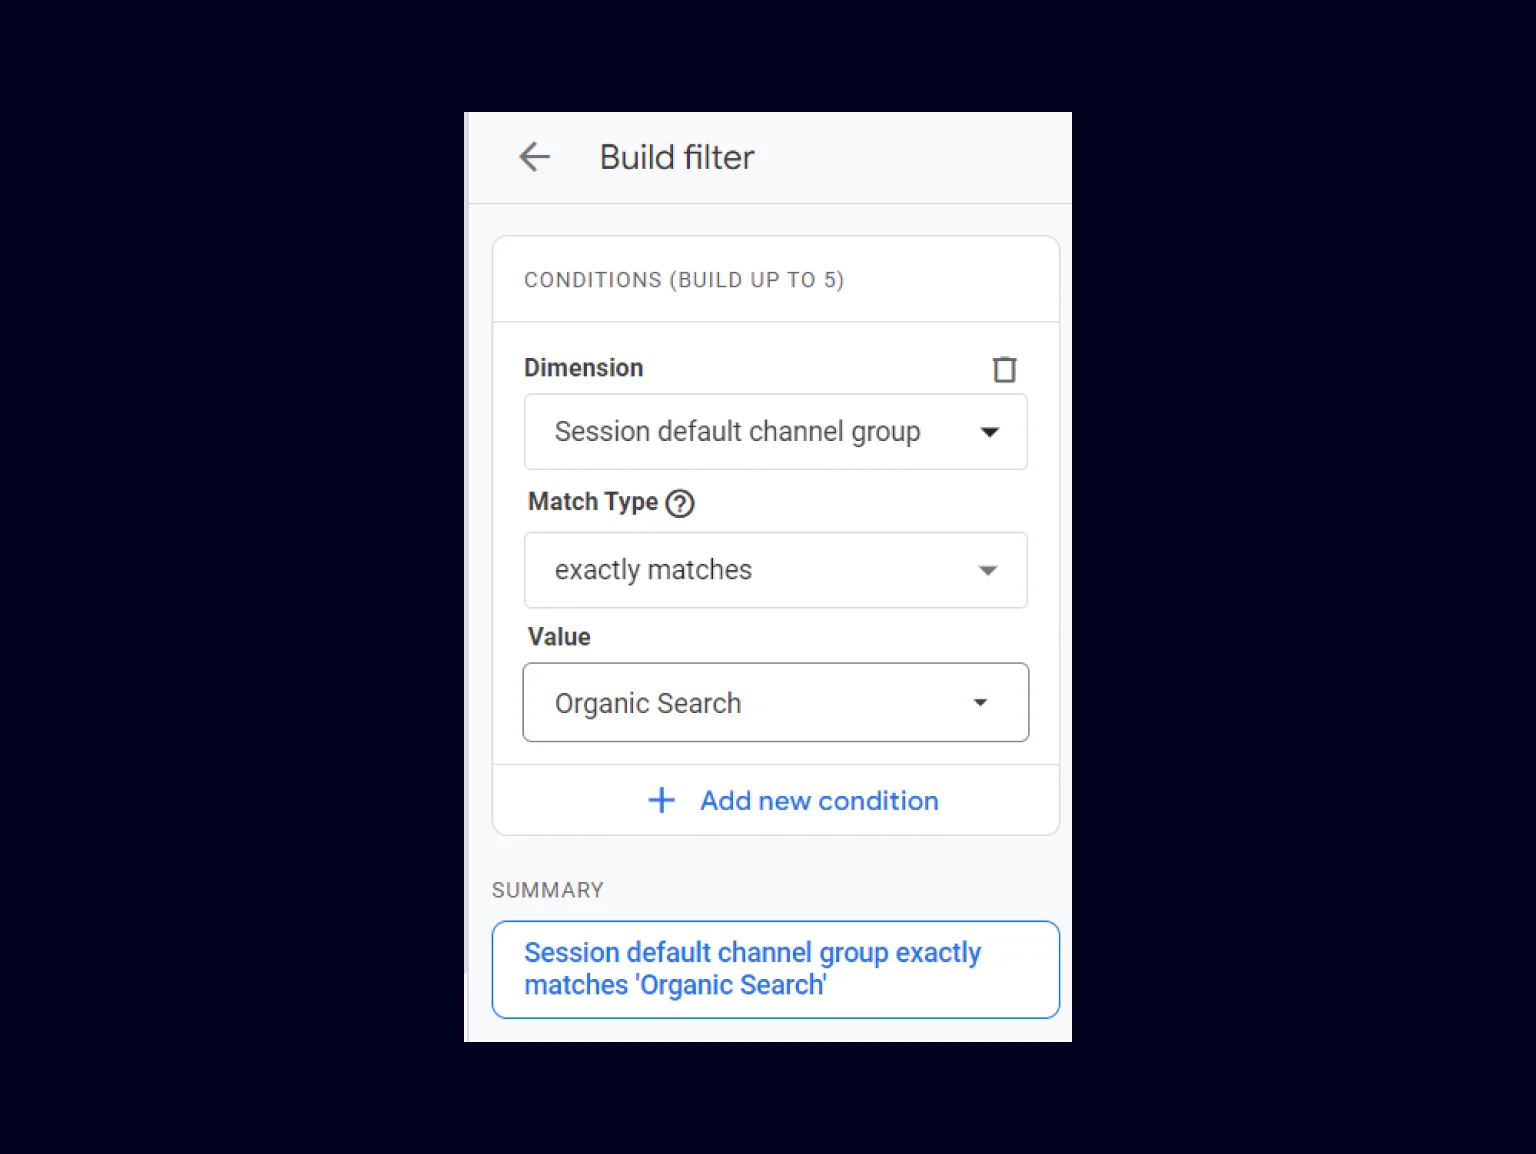
Our report is almost ready. The last step is to click on the Save button, choose “Save as a new report” and give it a name. In our case, it’s Countries by Organic Traffic (Custom). Then, we need to add the report to the Reports panel. This can be done in the Library > Collections > Edit collection section. Finally, we’ll add the report to the desired collection and save it.
Now, our report appears in the Reports section.

Mobile traffic on specific pages
Now, let’s delve into a scenario where we require insights into mobile traffic on specific pages. This can be done by customizing an existing standard report: Reports > Engagement > Pages and Screens. Upon clicking on Edit, within the report settings, we must select the Add filter option.
Next, in the filter builder under the Dimension section, choose the Device category, and for the filter value, select mobile. After that, apply the filter settings.

Now, we can see pages with mobile traffic and analyze it. Don’t forget to save this report as new if you want to use it in the future. For example, save it under the name Pages on Mobile Device. To display the report on the sidebar of the Reports section, add the new report to a Collection in the Library section, as described above.
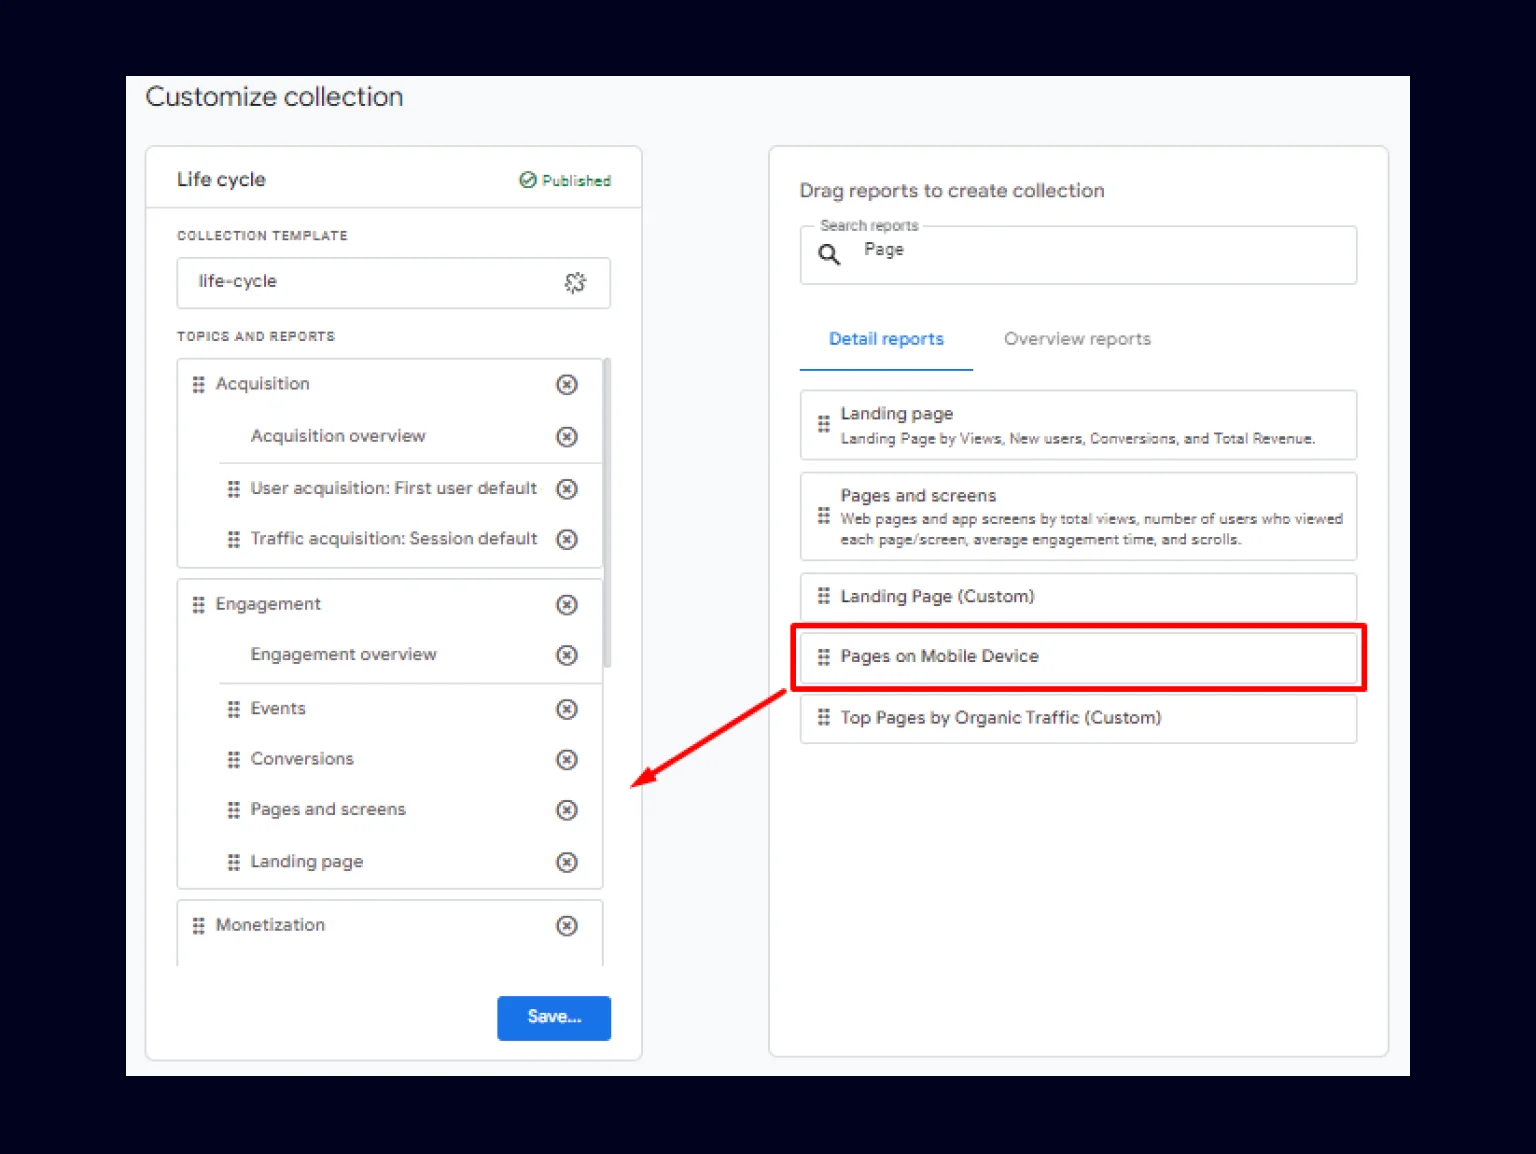
That’s it. Our new report for viewing pages with mobile traffic is ready. It can be found by navigating to Reports > Engagement > Pages on Mobile Device. Everyone who has access to this GA4 account will be able to use this report.
Referral traffic
Now, let’s see another example when we need to know from which external websites we receive traffic. This data is important for link-building strategy, helping to identify areas where content works at its best. In this case, we will base our report on Reports > Acquisition > Traffic Acquisition. In the report settings, add a Session default channel group filter, which will correspond to the Referral value.
After, in the Table Settings, you should opt for Session Source from the dropdown menu in the first column. Within the generated report, we’ll observe the sources contributing to direct traffic on our website. Remember to save the report as new and rename it for easy retrieval and utilization. Also, consider adding this report to a collection for easy access.
Google search console report
This is a very important report if you are working on SEO tasks and using Google Search Console.
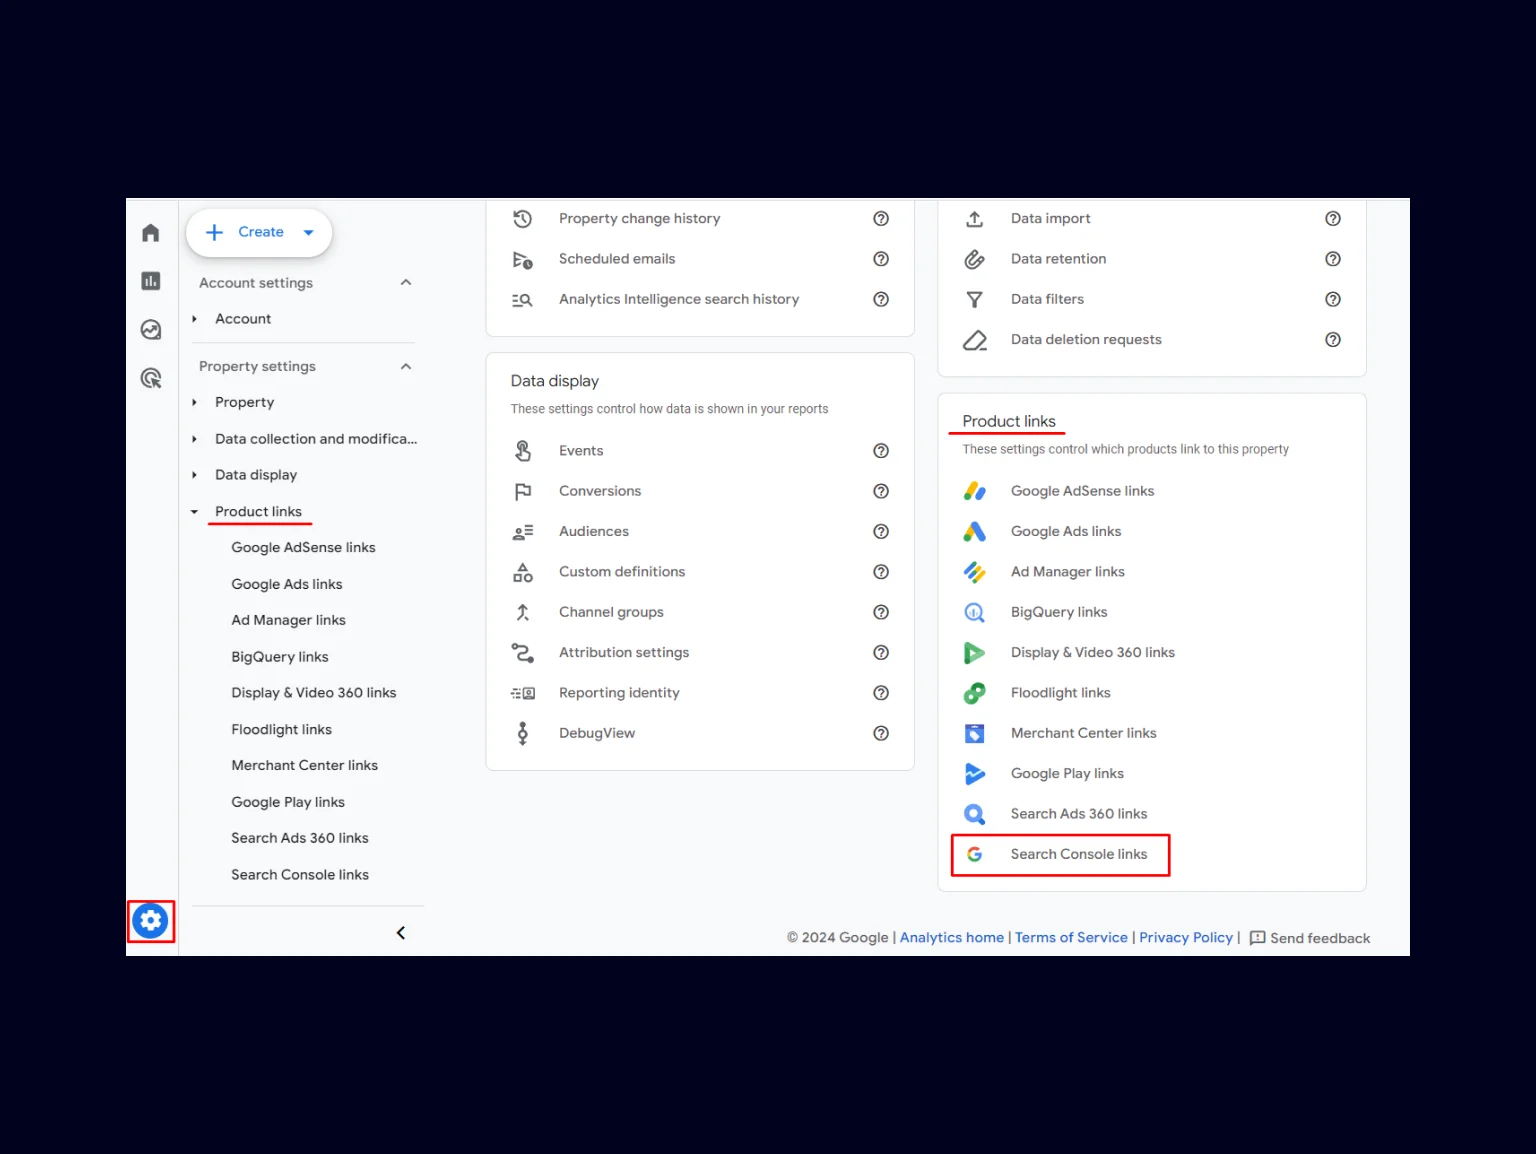
After connecting Google Search Console to GA4, you need to create a new Collection in the Library section for the report to appear in the Report section. You can do it in the GA4 account settings.
Limitations
GA4, with its ongoing development, boasts a constantly evolving interface. This can be both a benefit and a challenge. While new features and improvements are introduced, users may encounter occasional shifts in menu item names and functionalities, requiring some adaptation.
However, a more significant limitation for those transitioning from Universal Analytics is the inability to directly transfer historical data to GA4.
To sum it up
Personalization of reports in GA4 is an effective way to improve and expand some capabilities of standard reports. Thus, we have the opportunity to precisely adjust the interface and the information we need according to specific goals and tasks.
However, there are also areas for improvement that we anticipate will be addressed soon. One such area is the ability to transfer personal report templates between different business accounts, which would make the process more user-friendly and save time by avoiding repetitive actions.
If this article proved useful for you, share it with friends and see other SEO-related pieces in our blog. Also, whether you need help with creating custom reports, feel free to text us anytime — Halo Lab is always here for you!
Writing team:

Viktoriia
Technical writer

Dmуtro
Editor
Have a project
in your mind?
Let’s communicate.
in your mind?
Let’s communicate.

Frequently Asked Questions
Can I create a custom home report in GA4?
No, you cannot create a new report on the homepage. The homepage displays information based on your actions in GA4. The reports shown on the homepage are those most frequently used.
Can I create a custom real-time report in GA4?
No, creating new custom Real-Time reports is not possible. However, you can modify some existing indicators, elements, or views and save them as a new report.
How to download custom reports in GA4?
Downloading a custom report in GA4 is easy. In the Reports section, select the desired report. In the upper right corner, click on the Share this report icon and choose the Download file option. The file can be downloaded in PDF and CSV formats.
What does unlink report mean in GA4?
In GA4, reports can be linked to templates, meaning any edits made to the template automatically update all linked reports. However, you can choose to “unlink” a report. This essentially breaks the connection between the report and the template. Consequently, changes made to the template won’t affect the unlinked report — it will maintain its current configuration and data.
Can I create a custom Reports Snapshot?
Yes, it is possible to customize Reports Snapshot for your tasks. First, create a set of overview reports and then add them to Reports Snapshot. Only an Editor can edit Reports Snapshot.
How to delete a report?
Deleting a report is very simple — just use the Delete option in the report’s settings menu.